When a market is overbought, many investors will try to look for opportunities to roll their position and take their money off the table. They must evaluate whether their portfolio needs to be adjusted to lessen the risk of a decline in the market. Bollinger Bands are a tool that can be used for this purpose.
Reading Bollinger Bands
A Bollinger Band uses the 20-Day Simple Moving Average as a mid-point, with the upper Bollinger Band equal to 2 daily standard deviations over the center price, and the lower Bollinger Band equal to 2 daily standard deviations under the center price.
Standard deviations are a range of values that follows the average of each day. So, if the numbers deviate a little, the Bollinger Bands are closer to the average, but if they deviate by a significant amount, then the Bollinger Bands are wider.

Standard deviations assume that a stock follows a Normal Distribution. The graph above shows a standard assumption of random price movement, with the normal price behavior of below 2 standard deviations 95% of the time. Any move bigger than this would indicate an outlier.
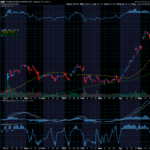
The chart below shows a visual representation of when the market has been overbought or oversold. The stock is overbought when the price of the stock or ETF has gone through the Upper Bollinger Band. Since the movement is relatively rapid, it might be worrisome concerning the potential for continued movement.
Similarly, if the market is oversold¸ it can be indicated through a price moving through the lower Bollinger Band. It also has the potential to have a near term bounce back towards the middle of the Bollinger Bands.

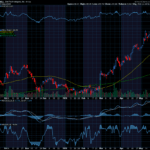
It shows the price of the ETF moving through the lower Bollinger Band (light green highlighted area) through September and October, with a steady 20-Day Moving Average in December, followed by a flip in trend. Then, prices moved through the upper Bollinger Band in January and March.
This shows that Bollinger Bands are useful in indicating when it is time to hedge your portfolio or roll back your positions.


Trackbacks/Pingbacks