
Happy Thankful Tuesday!
I am excited to share that you don’t need special education or to sit in front of the computer all day to trade options. It can be easily learned if you are interested in spending an hour or so a week earning money in what could be considered “renting” stocks for a short period of time.
This is why I show you the details about an equity’s symbol and pattern each week.
I am typing this on Sunday. The Nasdaq was down 4 out of 5 days. But I did spot a potential 48% profit just waiting to be made. Read on to see how you can get in on it.
For the updates on previously discussed symbols, please scroll down.
For today’s Trade of the Day, we will be looking at JD.com (JD).
Before analyzing JD’s chart, let’s take a closer look at the company and its services.
JD.com, Inc. operates as an e-commerce company and retail infrastructure service provider in the People’s Republic of China. It operates in two segments, JD Retail and New Businesses. The company offers home appliances; mobile handsets and other digital products; desktop, laptop, and other computers, as well as printers and other office equipment; furniture and household goods; apparel; cosmetics, personal care items, and pet products; women’s shoes, bags, jewelry, and luxury goods; men’s shoes, sports gears, and fitness equipment; automobiles and accessories; maternal and childcare products, toys, and musical instruments; and food, beverage, and fresh produce. It also provides gifts, flowers, and plants; pharmaceutical and healthcare products, including OCT pharmaceutical products, nutritional supplements, healthcare services, and other healthcare equipment; books, e-books, music, movie, and other media products; and virtual goods, such as online travel agency, attraction tickets, and prepaid phone and game cards, as well as industrial products and installation and maintenance services. The company has strategic cooperation agreement with Tencent Holdings Limited. JD.com, Inc. was incorporated in 2006 and is headquartered in Beijing, China.
Each candle on the chart represents price movement over a 5-day (week) period. The indicator at the bottom of the chart is a Channel Commodity Index (CCI).
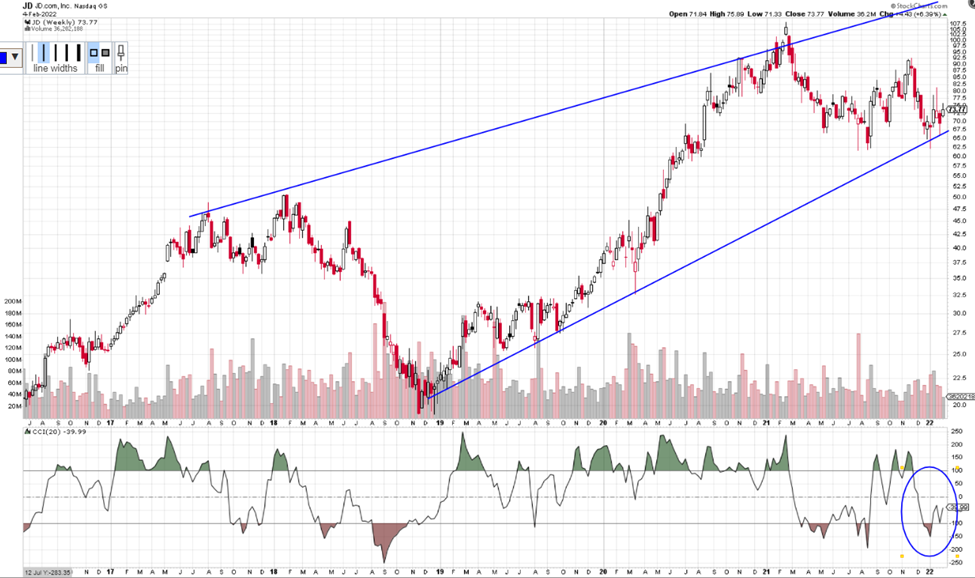

A cross up through the CCI zero or 100 line is bullish, in that it is suggesting price has gone from bullish to even more bullish. A cross up through the zero line and a cross through -100, suggests price is bearish. If you want to learn more about the CCI, you can read through the short section below or you can scroll down to the alert signal.
Channel Commodity Index
A cross up and over the CCI -100 or the zero line can issue an entry signal as it moves from being bearish to bullish. A rise toward 100 is a continuation of that bullishness. Up through the 100 line creates a green fin of bullishness, until it drops back down through the 100-line.
A break below the zero line means it has gone from bullish to bearish and a drop below -100 suggests even more bearishness.
The Commodity Channel Index (CCI) is a versatile indicator that can be used to identify a new trend or warn of extreme conditions. Originally, it was developed to identify cyclical turns in commodities, but the indicator can be successfully applied to indices, ETFs, stocks and other securities. In general, CCI measures the current price level relative to an average price level over a given period. CCI is relatively high when prices are far above their average but is relatively low when prices are far below their average. In this manner, CCI can be used to identify overbought and oversold levels or breaks from one level to another.
Check Out How This Pull Back Could Pay Out Big Time
JD’s is bullish as it rises to the 0 and possibly further near the 100 line. This week’s candle is apt to continue its upward movement. We are looking for a continued move to $75 before considering entry. The short term target is $76 and then higher.
If you find that you like the CCI Indicator as an easy-to-read indicator, it is included in the 5-Star Academy educational program which includes a chatroom where I am during the day to do live teaching sessions on M-W-F and to answer questions during the day. It is an incredibly supportive community.
Potential Profit Play for JD
If JD’s price continues to move up, you could consider a Call trade. I am writing this on Sunday, if price continues to move to $75 when you receive this on Tuesday, you could consider a call option trade. We are expecting the CCI indicator to continue moving to the 100 line.
These examples are listed as an example to show how options work and the advantages they offer.
To buy shares of JD.com (JD) stock today, it would cost approximately $74 per share. If you bought 10 shares it would cost $740. If price rose to the short term goal of $76 that would be a $20 profit. Not much of a profit on a $740 investment.
Option trading offers the potential of a lower initial investment and higher percentage gain. It is like renting stock versus buying out right. Let’s take a look.
If you bought one Call option contract covering 100 shares of JD’s’s stock with a March 18th (Mar22) expiration date for the 75 strike, the premium would be approximately $5.20 per share or a total of $520 for the contract of 100 shares. If price rose the expected $5 over the next few weeks, the premium would likely increase approximately $2.50 to $7.70. This is a gain of 48% profit. That would be a nice trade over a short period of time!
It is exciting to make money if price rises or falls.
I want to remind you that you can sell to close and take profit any time along the line before the expiration date. You don’t have to hold the contract until expiration.
Options often offer a smaller overall investment, covering more shares of stock and potential for greater profits. This is like renting stocks versus having to pay full price to buy.
This said, if you are having any kind of trouble taking advantage of these trades, we don’t want you to miss out. I have put together programs that help traders just like you access the potential profits that options provide. Be sure to check out the programs (like 5-Star Academy mentioned earlier) shared in this email and we will make it easy for you to get your share.
I love to trade, and I love to teach. It is my thing.
Yours for a prosperous future,
Wendy Kirkland
PS-I have created this daily letter to help you see the great potential you can realize by trading options. Being able to recognize these set ups are a key first step in generating wealth with options. Once you are in a trade, there is a huge range of tools that can be used to manage the many possibilities that can present themselves. If you are interested in learning how to apply these tools and increase the potential of each trade, click here to learn more.

Previous Trade Candidates:
Two weeks ago, we discussed a possible AMD trade. If you had bought the 110 Feb 18th expiration, put on Tuesday 2/1 it would have cost 8.85. If you sold on Thursday 2/3, the premium would have been 12.10 or a 37% profit. We will continue to watch this trade.
Last week we discussed buying QCOM 160 Feb18th Puts. The price never fell to the trade entry target. We will continue to watch this.


Recent Comments