
Happy Thriving Thursday!
Last week, the market was down 2 days out of 5 trading days. It remains in the same range that it has been in for months. Like a pinball back and forth.
Am going to call Thursday “SPY Day”. Each Thursday, I will focus on what SPY is doing, with the hope it will help give us a clue about the market’s upcoming moves. In fact, I have outlined a great trade to keep your eye on that could pull in a healthy win even in this thrashing market. Keep reading and I’ll walk you through it.
SPY or the SPDR S&P 500 trust is an exchange-traded fund which trades on the NYSE Arca under the symbol SPY. SPDR is an acronym for the Standard & Poor’s Depositary Receipts, the former name of the ETF. It is designed to track the S&P 500 stock market index. This fund is the largest ETF in the world and gives a good overall picture of the market. SPY includes shares from the top 500 companies.
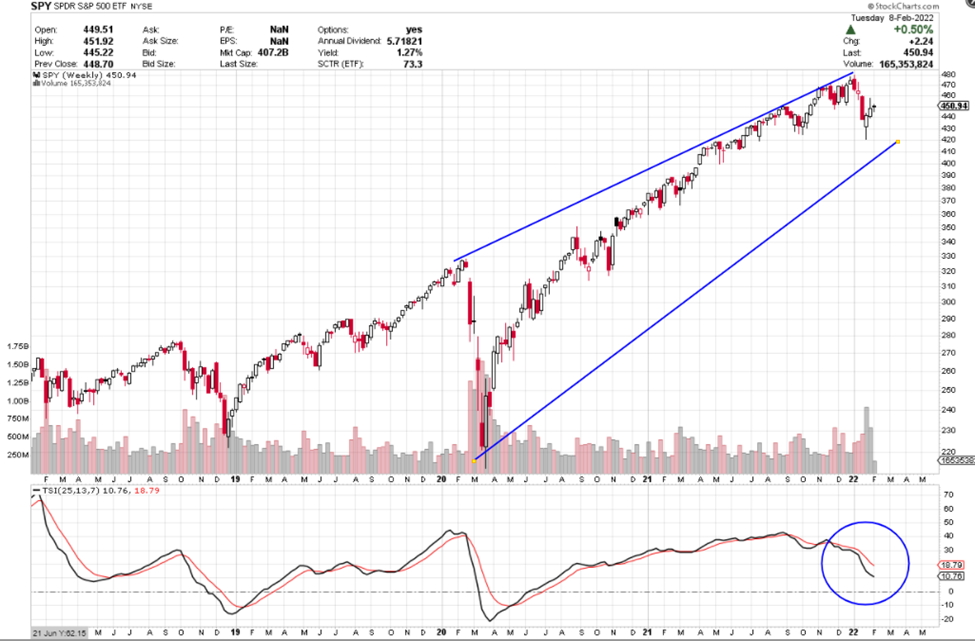
The chart of the S&P below is a weekly chart with a TSI indicator at the bottom. The description coming up next explains how to use the TSI.
True Strength Indicator
The True Strength Index (TSI) is an oscillator that fluctuates between positive and negative territory. As with many momentum oscillators, the centerline defines the overall bias. The bulls have the momentum edge when TSI is positive, and the bears have the edge when it’s negative. As with MACD, a signal line can be applied to identify upturns and downturns. Signal line crossovers are, however, quite frequent and require further filtering with other techniques. Chartists can also look for bullish and bearish divergences to anticipate trend reversals; however, keep in mind that divergences can be misleading in a strong trend.
TSI is somewhat unique because it tracks the underlying price quite well. In other words, the oscillator can capture a sustained move in one direction or the other. The peaks and troughs in the oscillator often match the peaks and troughs in price. In this regard, chartists can draw trend lines and mark support/resistance levels using TSI. Line breaks as well as line crosses can then be used to generate signals.

TSI Buy Signal
Each candle on the chart represents price movement over one week. On the line indicator at the bottom of the chart, it appears that the TSI line is turned down indicating a bearish move. There is still a good bit of white space between the lines. The red line is still above the black. The candle for this week is currently positive. This gives mixed signals. The TSI indicator is bearish, but the candles are bullish. This may be a time to hold off on placing a trade until the direction is clear.
Price will likely remain between the trend lines on this chart. Trades can be placed when price is in that range since there is about a $70 range there. Since the swings have been back and forth, trades may be shorter than what weekly charts often are traded. Watching the chart will help you decide if a Call or a Put trade is possible.
Check out the profit potential of option trading versus buying stock. Big difference!!!
Potential Profit Play:
To buy shares of SPY today would cost approximately $451 per share (as I write this on Tuesday).
Option trading is truly unique in its ability to give traders the opportunity to trade an equity’s price move in either direction. Since the TSI indicator is bearish we are going to look at buying Puts.
I want to stress, when you trade options, you can close the trade anywhere along the line to take profit (or loss). You don’t have to wait until it hits the target or until expiration day. You also want to wait for the indicator confirmation and don’t jump-the-gun with an early entry.
If SPY’s price continues to go down to $450 and the TSI shows a downward trend, you could consider a Put trade. The first short term target would be $445. If you bought the $445 strike March 18th expiration as of today it would cost around $9.27. If price fell to the expected $445 target you could expect a possible $2.50 gain on your premium or a 27% profit.
Trading options can be a win, win, win opportunity. Options often offer a smaller overall investment, covering more shares of stock and potential for greater profits.
What’s Next? I Can Hardly Wait!
Keep an eye on your inbox and I will keep sharing what I have my eye on. If you want to get deeper into how I find these winners, be sure to check out the programs in the banners in this message to learn more about options.
I love teaching and write my strategy books as clear as I write these emails. I try to think of the questions you’ll ask before you ask them. Sign up and join me in the profit potential.
Yours for a prosperous future,
Wendy Kirkland
Past Trades:
Last week we discussed buying Feb 18th 445 Puts at $4.93. Although the price moved down to the entry target the premium has not moved much. We will continue to watch this trade.


Recent Comments