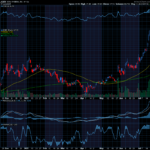
The Moving Average Convergence/ Divergence (MACD) uses moving averages to create a momentum indicator by subtracting the longer-term moving average from the shorter-term moving average. The moving average periods that we choose to use for our MACD indicator are the 52-Day EMA & 24-Day EMA. Traditionally the MACD indicator uses periods that are half the length of our selected periods. We choose to use the longer periods as it is more representative of a stock’s medium-term momentum. The MACD is calculated by subtracting a stock’s longer term 52-Day exponential moving average (EMA) from its shorter term 24-Day EMA. This creates the MACD line. This MACD line is used in conjunction with the 18-Day EMA which functions as the ‘trigger’ line.

When a stock’s MACD line crosses above the 18-Day EMA, this indicates strengthening momentum for the stock and a ‘Buy’ signal. When a stock’s MACD line crosses below the 18-Day EMA, this indicates weakening momentum for the stock and a ‘Sell’ signal. MACD is more of a leading indicator than a moving average crossover which tends to lag price movement. Our team uses MACD as a type of secondary indicator to help validate ‘Buy’/’Sell’ signals and momentum trends for stocks.
Thanks,
Chuck Hughes


Recent Comments