Today I’d like to discuss a few of my favorite trading indicators: Average Directional Index, True Strength Indicator, Channel Commodity Index, Fibonacci Exponential Moving Averages (EMA)
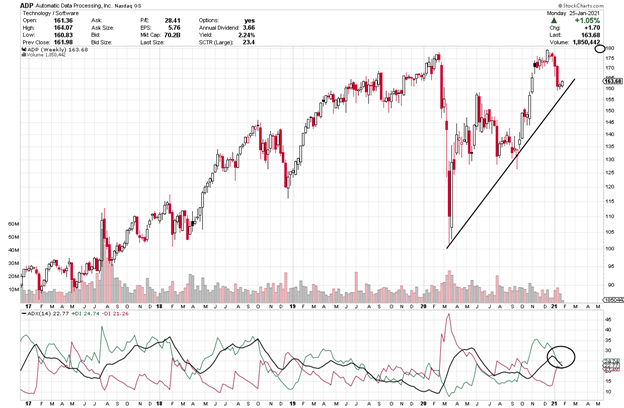
Average Directional Index (ADX) is an easy indicator to interpret. The +DI line (green) is bullish and when it is on top, it suggests price is going to head up. When the -DI line (red) is on top, it suggests price is going to drop.
The black line is the strength line and when it heads up, it is telling you strength is moving into the DI line that is on top and in control. When the ADX line has been heading down, the DI line on top has been weakening and is ready for a change.
When the DI lines swap places and cross up and the ADX heads up, it suggests strength is moving into the new DI direction.
True Strength Indicator
The True Strength Index (TSI) is an oscillator that fluctuates between positive and negative territory. As with many momentum oscillators, the centerline defines the overall bias. The bulls have the momentum edge when TSI is positive and the bears have the edge when it’s negative. As with MACD, a signal line can be applied to identify upturns and downturns. Signal line crossovers are, however, quite frequent and require further filtering with other techniques. Chartists can also look for bullish and bearish divergences to anticipate trend reversals; however, keep in mind that divergences can be misleading in a strong trend.
TSI is somewhat unique because it tracks the underlying price quite well. In other words, the oscillator can capture a sustained move in one direction or the other. The peaks and troughs in the oscillator often match the peaks and troughs in price. In this regard, chartists can draw trend lines and mark support/resistance levels using TSI. Line breaks as well as line crosses can then be used to generate signals.
Plain and Simple
On the line indicator at the bottom of the chart, look how the white space between the black and red lines has widened and the black line is heading straight up. It has just a short way before a cross over the zero which will confirm even more strength.
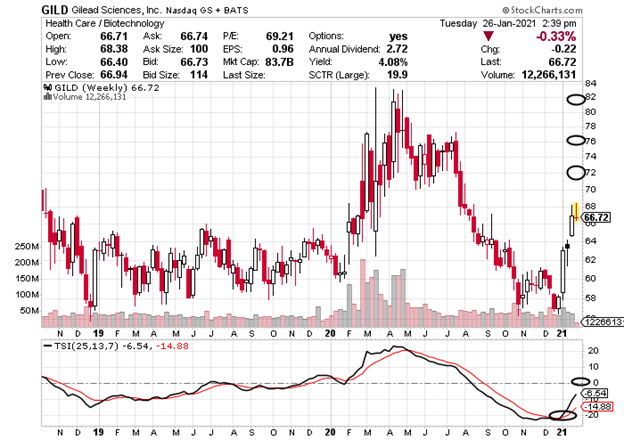
TSI Buy Signal
Each candle on the chart represents price movement over one day. GILD gave buy signal when the TSI Line crosses up and over the signal line. The line is heading up nicely and as it crosses the zero line will be a confirmation or in a sense, gives a second entry.
Channel Commodity Index
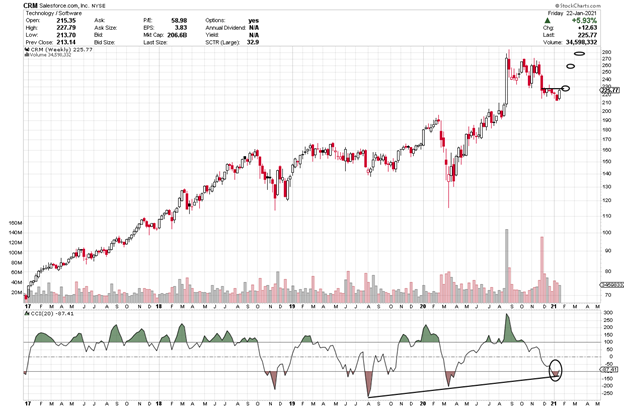
A cross up and over the CCI -100 or the zero line can issue an entry signal as it moves from being bearish to bullish.
The Commodity Channel Index (CCI) is a versatile indicator that can be used to identify a new trend or warn of extreme conditions. Originally, it was developed to identify cyclical turns in commodities, but the indicator can be successfully applied to indices, ETFs, stocks and other securities. In general, CCI measures the current price level relative to an average price level over a given period of time. CCI is relatively high when prices are far above their average, but is relatively low when prices are far below their average. In this manner, CCI can be used to identify overbought and oversold levels.
Fibonacci Exponential Moving Averages (EMA)
Exponential moving averages (EMAs) reduce the lag seen in simple moving averages by applying more weight to recent prices. The weighting applied to the most recent price depends on the number of periods in the moving average. We are applying 8, 21, and 55 weekly periods for our entry signals. EMAs differ from simple moving averages in that a given day’s EMA calculation depends on the EMA calculations for all the days prior to that day. You need far more than 10 days of data to calculate a reasonably accurate 10-day EMA.
There are three steps to calculating an exponential moving average (EMA). First, calculate the simple moving average for the initial EMA value. An exponential moving average (EMA) has to start somewhere, so a simple moving average is used as the previous period’s EMA in the first calculation. Second, calculate the weighting multiplier. Third, calculate the exponential moving average for each day between the initial EMA value and today, using the price, the multiplier, and the previous period’s EMA value.
Charting services like Stockcharts.com and your broker’s chart service figure these calculations for you.
As mentioned, entry signals are based on the use of 8, 21, and 55 weekly averages. (8, 21 and 55 are Fibonacci numbers which are a special sequence of numbers which are added together- 1+1= 2, 2+1=3, 2+3=5, 5+3= 8, etc. 13, 21, 34, 55, 89, 144, 233, 377, 600…
As mentioned, we are zeroing in on 8 EMA (short term), 21 EMA (medium term) and 55 EMA (long term).


Recent Comments