
Dear Reader,
Yesterday we looked at a MACD chart of Murphy USA INC., noting the stock produced a recent MACD ‘Buy’ Signal crossover.
For today’s Trade of the Day we will be looking at a Daily Price chart for Richardson Electronics, stock symbol: RELL.
Before breaking down RELL’s daily price chart let’s first review which products and services are offered by the company.
Richardson Electronics, Ltd. engages in the power and microwave technologies, customized display solutions, and healthcare businesses in North America, the Asia Pacific, Europe, and Latin America.
Now, let’s begin to break down the Daily Price chart for RELL. Below is a Daily Price Chart with the price line displayed by an HLC bar.
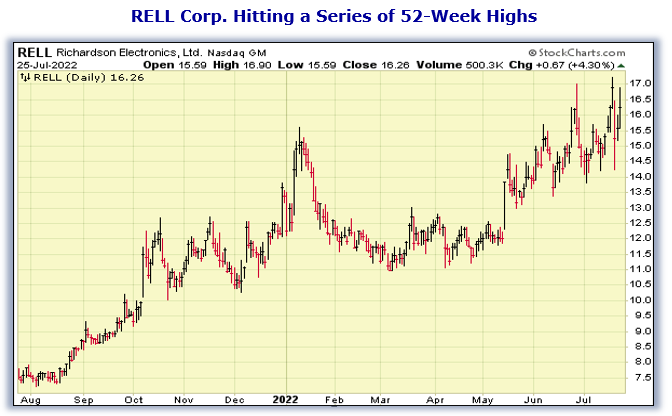
Buy RELL Stock
The Daily Price chart above shows that RELL stock has recently hit a 52-Week High less than a week ago.
Simply put, a stock does not just hit a new 52-Week High unless it is in a very strong bullish trend.
The Hughes Optioneering team looks for stocks that are making 52-Week Highs as this is a good indicator that the stock is in a powerful uptrend.
Our initial price target for RELL stock is $17.07 per share.

Profit if RELL Is Down 10%
Now, since RELL recently hit a 52-week high and will likely continue to rally from here, let’s use the Optioneering calculator to look at the potential returns for a RELL covered call trade. Covered calls are also known as buy writes.
The Buy Write Calculator will calculate the profit/loss potential for a covered call trade based on the price change of the underlying stock/ETF at option expiration in this example from a 10% increase to a 10% decrease in RELL stock at option expiration.
The goal of this example is to demonstrate the ‘built in’ profit potential for covered calls and the ability of covered calls to profit if the underlying stock is up, down or flat at option expiration. Out of fairness to our paid option service subscribers we don’t list the option strike price used in the profit/loss calculation.
The prices and returns represented below were calculated based on the current stock and option pricing for RELL on 7/25/2022 before commissions.
Built in Profit Potential
For this covered call, the calculator analysis below reveals the cost or the breakeven price is $1,446 (circled). The maximum risk for a covered call is the cost of the covered call.
The analysis reveals that if RELL stock is flat at $16.26 at expiration the covered call will realize a $180 profit and a 12.4% return (circled).
If RELL decreases 10% at option expiration, the covered call would still produce a 1.2% or $17.40 return.
If RELL increases 10% at option expiration, the covered call would realize a profit of $304 or 21%.
Due to option pricing characteristics, this covered call has a ‘built in’ 21% profit potential when the trade was initiated*.
Covered call trades can result in a higher percentage of winning trades compared to a directional stock trade if you can profit when the underlying stock/ETF is up, down or flat.
A higher percentage of winning trades can give you the discipline needed to become a successful trader.
The Optioneering Team is here to help you identify winning trades just like this one.

Interested in accessing the Optioneering Calculators? Join one of Chuck‘s Trading Services for unlimited access! The Optioneering Team has option calculators for six different option strategies that allow you to calculate the profit potential for an option trade before you take the trade.
Get Trade Insights Directly From Chuck
See what he’s trading and when with his exclusive Inner Circle Trading Service where he will send you his hand-picked stock and option trades.
You can start getting market insights directly from 10-Time Trading Champion Chuck Hughes.
Just call Brad at 1-866-661-5664 or 1-310-647-5664 to join or CLICK HERE to schedule a call!
Wishing You the Best in Investing Success,

Chuck Hughes
Editor, Trade of the Day
Have any questions? Email us at dailytrade@chuckstod.com
*Trading incurs risk and some people lose money trading.


Recent Comments