

Markets are trying to fuel the rally but morning optimism and bullish pre open futures markets have been turning mid-day and giving back any gains. This is characteristic of an earnings week market. While you may see some big moves jump out of earnings reports it is an important time to check multiple time frames on any set ups you are considering. We talked about a handful of indicators the other day and one of them helps gauge if a ticker is over bought or oversold with just a glance.
Lets see how to look at Bollinger Bands to determine how reliable a trade will be.
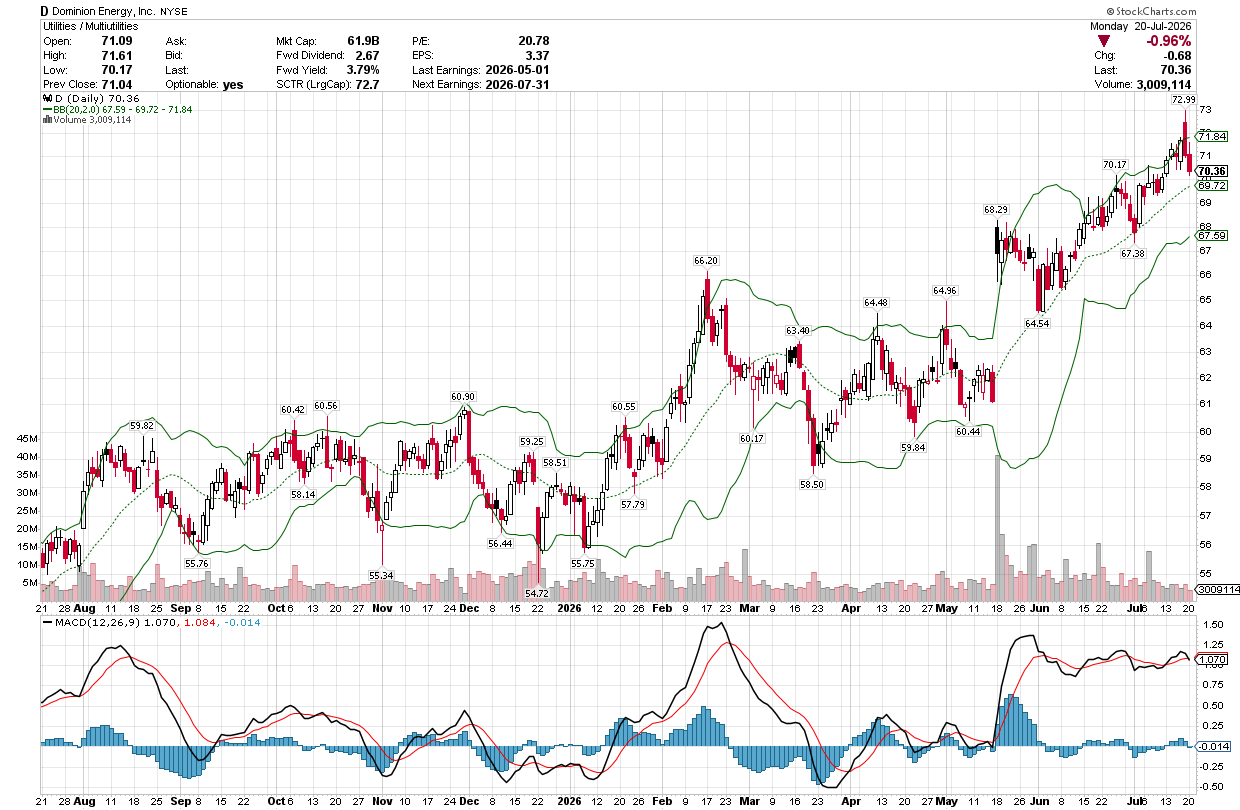
The Bollinger Bands appear on the chart above as two solid green lines and a dashed line down the middle. Here are a few great articles that dive deeper. They are based on the simple moving average and the top an bottom lines are two standard deviations away from the middle dashed line. Traders use price action above the top line to signal an overbought situation and the lower line to signal oversold. A trend that follows above the middle line but doesn’t go above the top line represents a strong bullish trend as we see in Dominion Energer (D) here.
Bollinger Bands act as a great piece to spot and confirm a trade. Notice that the MACD on this chart is not really offering any clarity and wouldn’t give a clear sign of the rally starting it late may. This is a reminder of why it is so important to have multiple indicators to be able to confirm moves and spot ideal entries and exits.
Keep learning and trade wisely,
John Boyer
Editor
Market Wealth Daily










Recent Comments