
The S&P is a creature of habit. It really likes certain patterns and when you start to see one setting up it can be pretty powerful. We have talked about how it loves to bounce off its 10 day moving average like it is being dribbled down the court. But if you look at the chart below you’ll see another pattern that can give us some solid insight into what to expect in the next few weeks.
When we see stronger momentum, the S&P moves farther above it’s 50 day moving average. There is a point that it often sees as too high and starts a pull back.

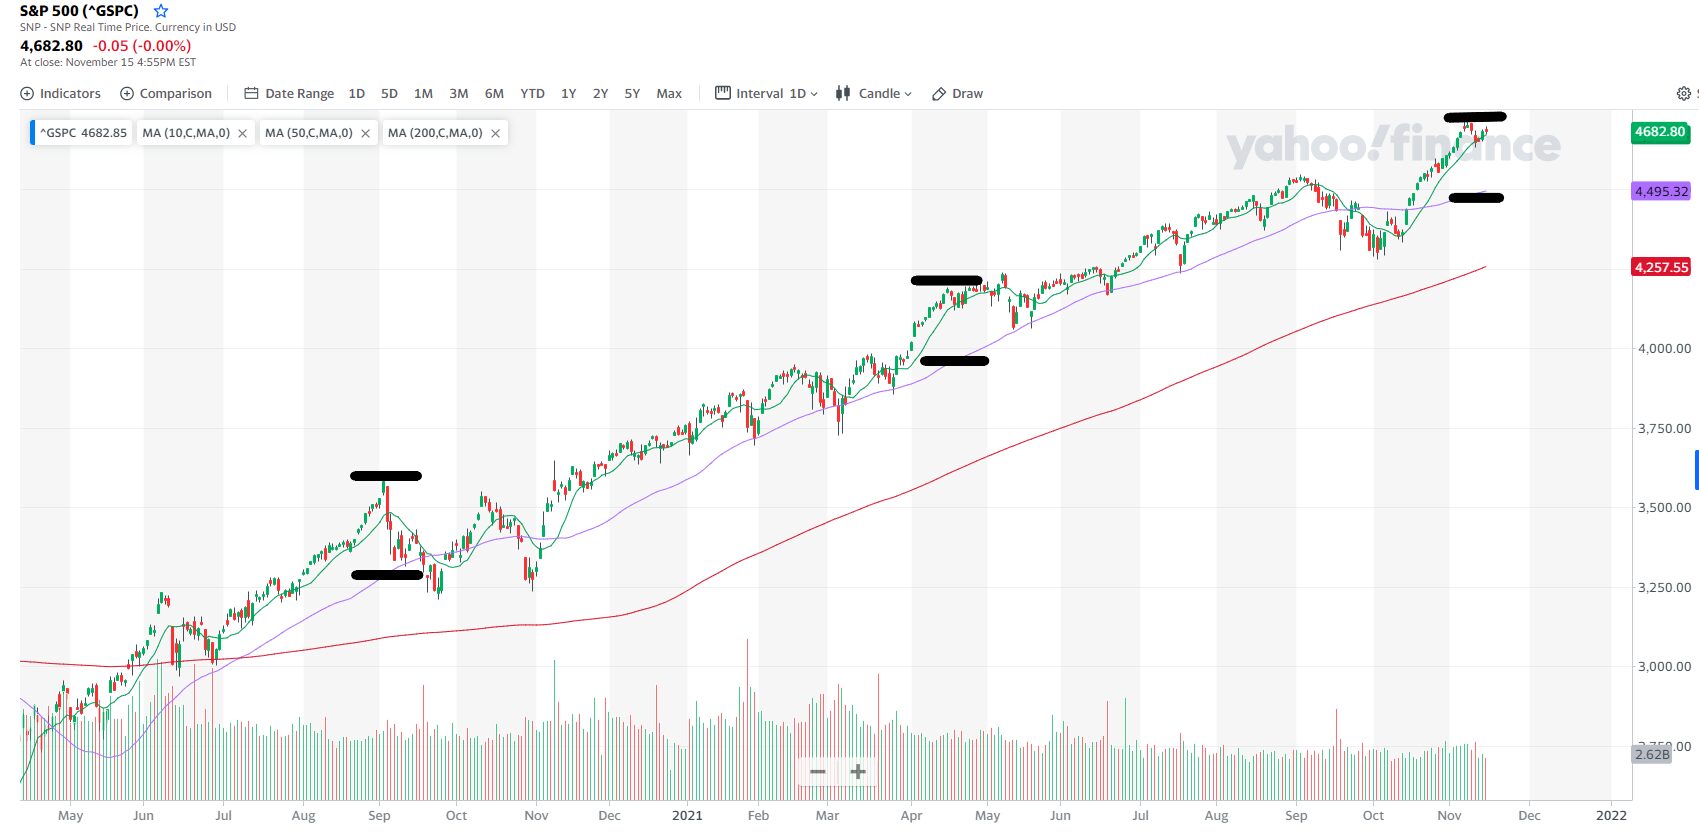
Each time it moves up to 200 points over the 50, it pulls back and tests support. We are seeing some resistance lately and could expect to see that happen again.
On the SPY, that would be a pullback to around 450 form the current 462. A Dec 23 put option with a strike of 455 is about $5 and would be a trade to consider.
These index trades are great when the set up but grabbing big moves on individual stocks has the potential to be lucrative. Ian Cooper’s Trade Alert 365 has been spotlighting some big winners. You can check it out here for just $1.
Keep learning and trade wisely,
John Boyer
Editor
Market Wealth Daily


Recent Comments