
Tuesday, August 3rd, 2021
Happy Thankful Tuesday!
I am excited to share that you don’t need special education or to sit in front of the computer all day to trade options. It can be easily learned if you are interested in spending an hour or so a week earning money in what could be considered “renting” stocks for a short period of time.
This is why I show you the details about an equity’s symbol and pattern each week.
I am typing this on Sunday, before the new week starts. Last week, the Dow was up 4 days out of 5 and it finally caught up to the other indices and hit and all-time high. It didn’t close at the high, but it touched it and pulled a little by close. The Summer months are often a quiet market time with slight pullbacks and then it recovers into the end of the year. We have been heading up for months and a pullback is due. We are in a wait and see mode.
For the updates on previously discussed symbols, please scroll down.
For today’s Trade of the Day, we will be looking at QUALCOMM Incorporated, Inc. symbol (QCOM).
Before analyzing QCOM’s chart, let’s take a closer look at the company and its services.
QUALCOMM Incorporated engages in the development and commercialization of foundational technologies and products are used in mobile devices and other wireless products, including network equipment, broadband gateway equipment, consumer electronic devices, and other connected devices worldwide. The company also provides development, and other services and related products to the United States government agencies and their contractors.
QUALCOMM Incorporated was founded in 1985 and is headquartered in San Diego, California.
Each candle on the chart represents price movement over a 5-day (week) period. The indicator at the bottom of the chart is a Channel Commodity Index (CCI).
I drew a line below the candles, if price stays above that line, the upward trend should continue. Watch for a continued rise toward its target.
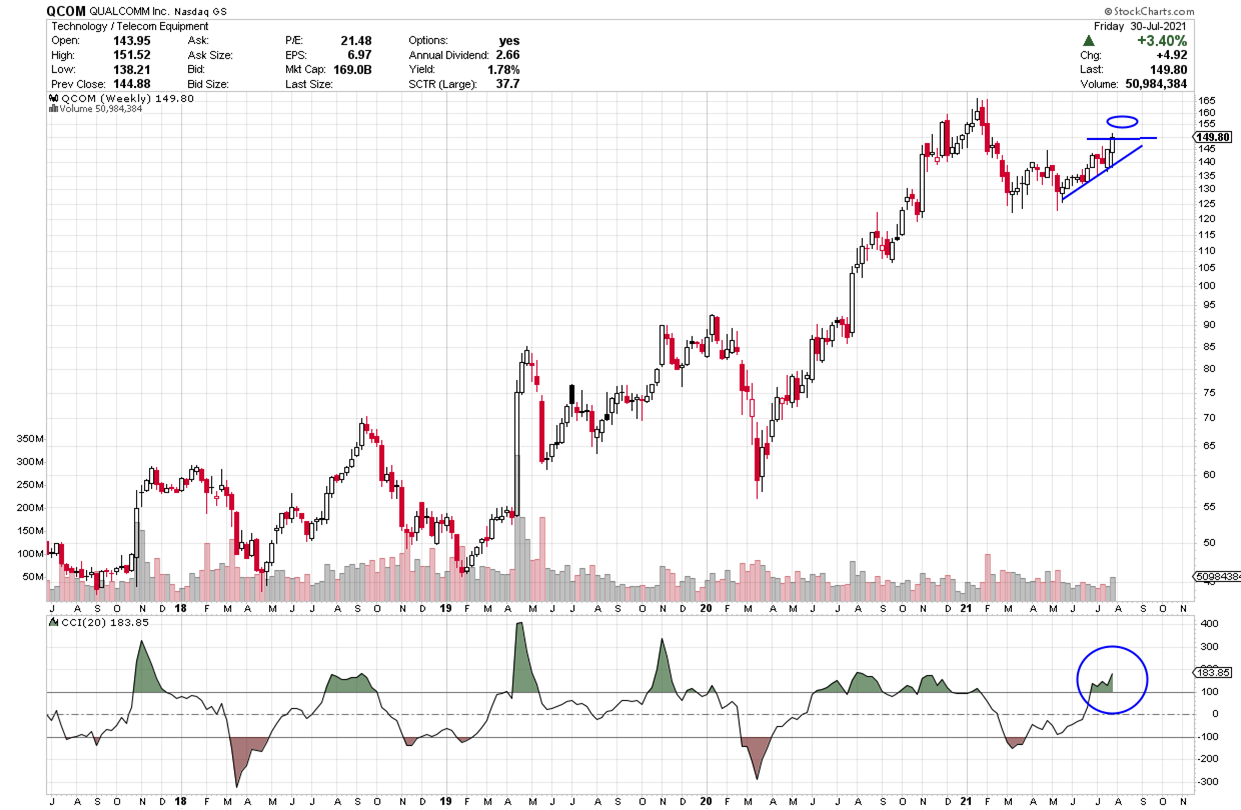

A cross down through the CCI zero or -100 line is bearish, in that it is suggesting price has gone from bearish to even more bearish. A cross up through the zero line and a cross through 100, suggests price is bullish. If you want to learn more about the CCI, you can read through the short section below or you can scroll down to the alert signal.
Channel Commodity Index
A cross up and over the CCI -100 or the zero line can issue an entry signal as it moves from being bearish to bullish. A rise toward 100 is a continuation of that bullishness. Up through the 100 line creates a green fin of bullishness, until it drops back down through the 100-line.
Also, a pullback and then, as it heads back up is another bullish indicator.
A break below the zero line means it has gone from bullish to bearish and a drop below -100 suggests even more bearishness.
The Commodity Channel Index (CCI) is a versatile indicator that can be used to identify a new trend or warn of extreme conditions. Originally, it was developed to identify cyclical turns in commodities, but the indicator can be successfully applied to indices, ETFs, stocks and other securities. In general, CCI measures the current price level relative to an average price level over a given period. CCI is relatively high when prices are far above their average but is relatively low when prices are far below their average. In this manner, CCI can be used to identify overbought and oversold levels or breaks from one level to another.
Check Out How This Rise in Price Could Pay Out Big Time
QCOM is bullish as it rises further above the 100 line. This week’s candle is apt to continue its upward movement that could take it higher. We are looking for a continued rise toward a price of $155 and then higher.
If you find that you like the CCI Indicator as an easy-to-read indicator, it is included in the 5-Star Academy educational program which includes a chatroom where I am during the day to do live teaching sessions on M-W-F and to answer questions during the day. It is an incredibly supportive community.
Potential Profit Play for QCOM
QCOM’s price continues to mov up. I am writing this on Sunday, if price continues to rise above 150 when you receive this on Tuesday, you could consider a call option trade. We are expecting the CCI indicator to continue rising above the 100 line and head up further.
Price is currently at approximately $149.80 as I write over the weekend and is expected to continue heading up to, perhaps, $155 and then higher.
If the CCI line stays above to the 100 line and then, continues up, price will continue its current uptrend and continue to rise. We will keep an eye on it over the course of the next few weeks.
The short-term price target for QCOM is $155 and, perhaps, higher.
To buy shares of QUALCOMM (QCOM) stock today would cost approximately $150 per share
I am suggesting that the price of QCOM may rise to $155.
Option trading offers the potential of a lower initial investment and higher percentage gain. It is like renting stock versus buying out right. Let’s take a look.
If you bought 2 shares of QCOM at $150 and it increased in price to $155, it would result in a profit of $5 or $10 for 2 shares or a 3% gain.
If you bought one Call option contract covering 100 shares of QCOM’s stock with an August 20th (Aug 21) expiration date for the 155 strike, the premium would be approximately 1.58 per share or a total of $158 for the contract of 100 shares. If price increased the expected $5 over the next few weeks to $155 target, the premium would increase approximately $3 to $4.58. This is a gain of $300 on your $158 investment or 190% profit. That would be a terrific trade!
It is exciting to make money if price rises or falls.
I want to remind you that you can sell to close and take profit any time along the line before the expiration date. You don’t have to hold the contract until expiration.
Options often offer a smaller overall investment, covering more shares of stock and potential for greater profits. This is like renting stocks versus having to pay full price to buy.
This said, if you are having any kind of trouble taking advantage of these trades, we don’t want you to miss out. I have put together programs that help traders just like you access the potential profits that options provide. Be sure to check out the programs (like 5-Star Academy mentioned earlier) shared in this email and we will make it easy for you to get your share.
I love to trade, and I love to teach. It is my thing.
PS-I have created this daily letter to help you see the great potential you can realize by trading options. Being able to recognize these set ups are a key first step in generating wealth with options. Once you are in a trade, there is a huge range of tools that can be used to manage the many possibilities that can present themselves. If you are interested in learning how to apply these tools and increase the potential of each trade, click here to learn more.

Previous Equities discuss:
Three weeks ago, we zeroed in on Starbucks (SBUX) with an August 6th expiration and 120 strike and a premium of 2.06. It went as high as 6.80 on Friday. That is a TERRIFIC 230% gain in two weeks. It is now down lower.
Last week, we studied CRM Aug 20 expiration and a 260 strike. With last week’s drop, it dropped enough to consider closing the trade.


Recent Comments