
Wednesday August 4th, 2021
Happy Wonderful Wednesday!
Last week, the market gave us two bullish days out of five. The three main indices moved sideways with daily swings.
To review past equity candidates, scroll down.
For today’s Trade of the Day, we will be looking Applied Materials, symbol (AMAT). Before analyzing AMAT’s chart, let’s take a closer look at the stock and its services.
Applied Materials, Inc. provides manufacturing equipment, services, and software to the semiconductor, display, and related industries. The company operates in the United States, China, Korea, Taiwan, Japan, Southeast Asia, and Europe.
Applied Materials, Inc. was founded in 1967 and is headquartered in Santa Clara, California.
I looked through a lot of charts over the weekend. I zeroed in on AMAT because it had a pullback in July and now looks ready to head higher. It is a widely traded stock with lots of volume.
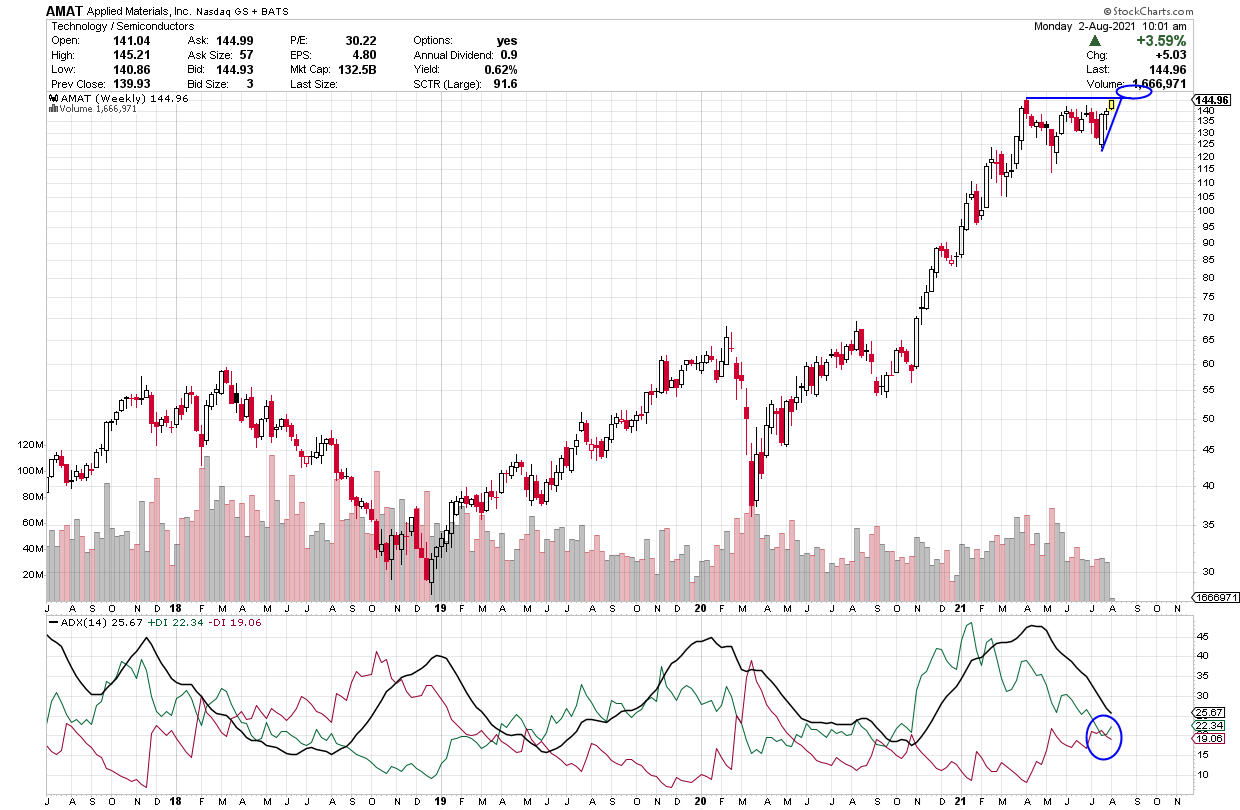
On the ADX indicator below the chart, notice how the green +DI line is on top. Because of that strength, the black line may soon turn up to show growing strength. These are all signals of strength with the thought that it may continue to climb.
For those who want more info on ADX, I give more details in the section below, or scroll down to the trade info.
Average Directional Index (ADX) Points to Direction and Strength
ADX is an easy indicator to interpret. The +DI line (green) is bullish and when it is on top, it suggests price is going to head up. When the -DI line (red) is on top, it suggests price is going to drop.
The black line is the strength line and when it heads up, it is telling you strength is moving into the DI line that is on top and in control. When the ADX line has been heading down, the DI line on top has been weakening and is ready for a change.
When the DI lines swap places and cross up and the ADX heads up, it suggests strength is moving into the new DI direction.
ADX signal = Profit Payout
Each candle on the chart represents price movement of a week. As the + DI heads up and moves above the black line and both remain above the red line, it suggests there is bullish strength that could continue to grow, especially once the black line starts to turn up. If price continues to move up, the ADX line (black) will turn to head up to imply that strength will continue to support the trade. As long as the ADX is heading up, it means it is supporting the bullish- up direction.
I am looking at its chart and possible trade on Monday, but the pattern should hold. You don’t want to consider entry if the current candle doesn’t move above the line drawn at about 145 or if it drops below slanted line at 140. Think of it as dropping through a floor. If that happened, you would not enter or you would close the trade.
AMAT Potential Trade
Please note and remember that I am typing this on Monday, two days before you receive it and the information, I am sharing could change over those two days and is intended to share the opportunities that options offer us.
Applied Materials (AMAT) last two weeks turned up from its pullback and this week it continued that upward move. It appears to be ready to reclaim recent highs. Its pattern should remain intact if price keeps rising. Notice the + DI is heading up and is well above the -DI line. We want the + DI to remain above the -DI (green above the red) to consider a trade. Green line on top is bullish.
Price is likely to rise further and eventually above 145 entry. Its first target is 150 as the +DI (green line) moves up and the ADX (black line) turns up. Its current uptrend should remain intact, and price should continue to rise, perhaps even higher to 155. We will keep an eye on AMAT over the next couple weeks.
I am looking at charts on Monday, so prices are apt to change a little by Wednesday.
The short-term price target for AMAT is $150, then, perhaps, $155, and higher.
To buy shares of AMAT today, price would be approximately 145. If it reaches its near-term target of $150 that would be a rise of $5 or 8.9% profit in a short period of time. If you bought 5 shares the total cost would be $750, and you would earn $25 total on the five shares.
This said, option trading offers the potential of a smaller initial investment and higher percentage gain even when price is expected to rise. Let’s take a look.
If you bought one Call option contract covering 100 shares of AMAT’s stock with an Aug 27th expiration date (Aug wk 4) for the $150 strike and premium would be approximately $3.60 today or a total of $360. If price increased the expected $5 to $150 target over the next few weeks, the premium might increase approximately $4 to $7.60 per share or $400 on your 100-share contract. This is a gain of $400 on your $360 investment or a 111% gain over a few weeks.
Remember you can close an option trade anywhere along the line before expiration to take gains or stop a loss.
The example above is a comparison of an investment of $750 and a $25 gain versus a $360 investment and $400 profit. Big difference.
Options can offer a win, win, win trade opportunity. They often offer a smaller overall investment, covering more shares of stock and potentially offer greater profits.
If you are having any kind of trouble taking advantage of these trades, I don’t want you to miss out. I have put together programs that help traders just like you access the potential profits that options provide. I write like we are having a conversation, so the information is easy to understand and apply. Be sure to check out the programs shared in this email and we will make it easy for you to get your share.
I love to trade, and I love to teach. It is my thing.
Yours For a Prosperous Future,
Wendy Kirkland
PS-I have created this daily letter to help you see the great potential you can realize by trading options. Being able to recognize these set ups are a key first step in generating wealth with options. Once you are in a trade, there is a huge range of tools that can be used to manage the many possibilities that can present themselves. If you are interested in learning how to apply these tools and increase the potential of each trade, click here to learn more.

Review of Past Candidates:
Two weeks ago, we studied QUALCOMM (QCOM). Last week, the week ended down. It broke its support level and trade should have been closed. It dropped further this week.
Last week we looked at ConocoPhillips (COP) with an Aug 20 expiration for the 62 strike and a premium of .60. Last week it pullback a bit so premium today it is .44. That said, this week it has started up and is likely to recover.


Recent Comments