
Friday, August 27th, 2021
Happy Fabulous Friday!
I teach everyday people (like me) to trade options. I do my best to write in an understandable way as if we are talking over the kitchen table.
The Dow has been up three days in a row as I type on Wednesday. The charts of the indices are down below the new highs they hit last. Despite being up for 3 days, the Dow hasn’t recovered to the all-time highs hit last week.
For today’s Trade of the Day, we will be studying Best Buy Co., Inc. (BBY).
Best Buy Co., Inc. retails technology products in the United States and Canada. Its stores provide computing and mobile phones, such as computing covering desktops, notebooks, and peripherals; mobile phones comprising related mobile network carrier commissions, networking products, tablets covering e-readers, and wearables, such as smartwatches; and consumer electronics consisting of digital imaging, health and fitness, home theater, portable audio comprising headphones and portable speakers, and smart home products. The company’s stores also offer appliances, such as dishwashers, laundry appliances, ovens, refrigerators, blenders, coffee makers, and vacuums; entertainment products consisting of drones, peripherals, movies, music, and toys, as well as gaming hardware and software, and virtual reality and other software products; and other products, such as beverages, snacks, and sundry items, as well as baby products, furniture, luggage, and sporting goods.
The company was formerly known as Sound of Music, Inc. Best Buy Co., Inc. was incorporated in 1966 and is headquartered in Richfield, Minnesota.
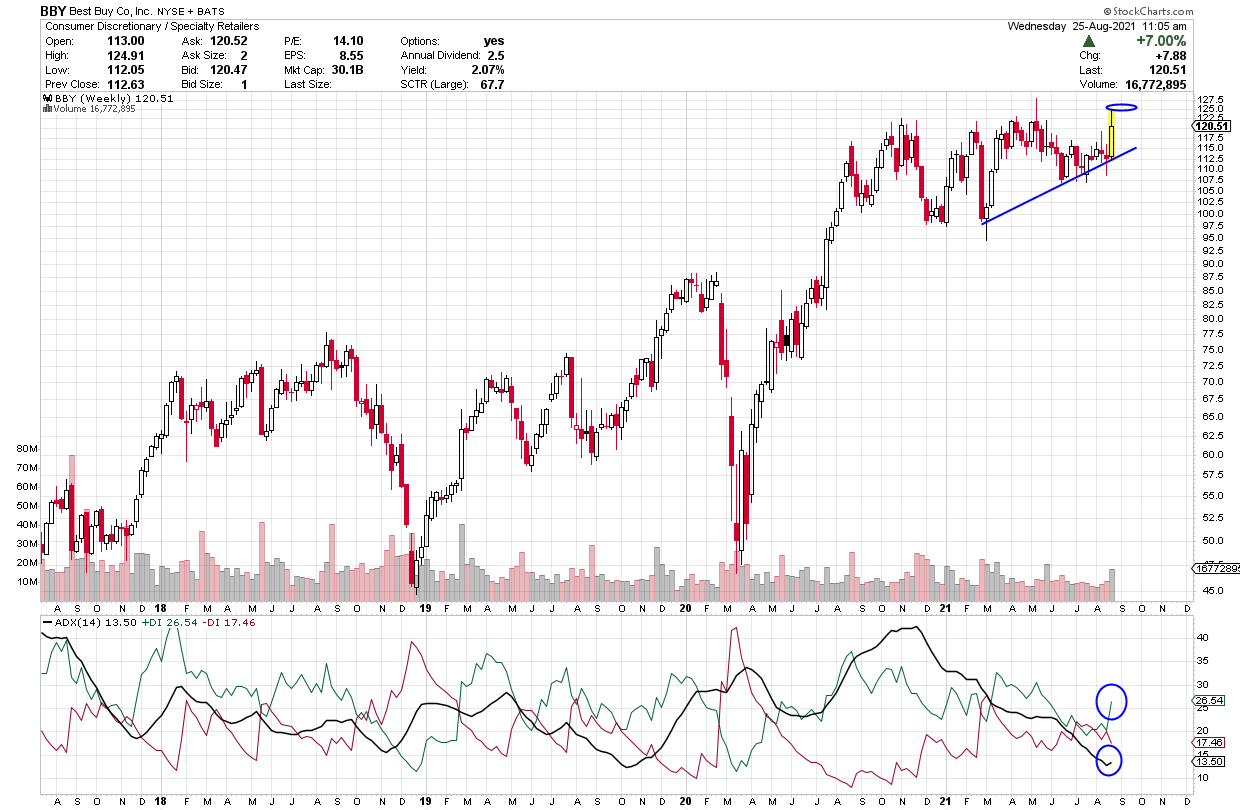
Let’s take a look at BBY’s weekly chart.
The ADX +DI (green line) is above the -DI and if it keeps heading up, the ADX line is starting to turn up. As long as the +DI is above the -DI, price should rise. Green above red is an indication of strength. When the +DI is bullish and the ADX turns up, it shows strength. If you want to learn more about ADX, read on or, if not, scroll down to the alert.
Average Direction Index (ADX) – Strength Indicator
The Average Directional Index consists of 3 lines: Green, Red and Black.
Green = +DI (Bullish)
Red = -DI (Bearish)
Black = ADX Strength Line
The DI line that is on top is in control. If the ADX line is heading up, strength is supporting the DI line that is on top and in control.
Check Out the Trade Alert Signal
Each candle on the chart represents price movement over a 5-day (week) period; therefore, it takes weeks for trades to play out. On the chart, the week is a bullish candle as I type. When the +DI crosses over the -DI line, it gives a buy signal [as the +DI line (green) appears as if it is in control and rising to head up on the ADX indicator, and as the ADX turns up that is even more bullish, suggesting an upward move is gaining strength. I’d like to see the green line to continue its upward bias and then the black line to continue turning up as well. It looks like it is starting to turn up and I hope it will continue. All are bullish signs of strength. When the +DI crosses the ADX (black line) and when it rises, it shows a new burst of strength coming into the equity.
The Black ADX line is a strength line and if it flips up and continues to head up, it shows strength, and we’ll know strength will continue to flow into this equity. We will keep an eye on BBY over the course of the next few weeks.
If BBYs price moves above $121, you could consider a trade. The short-term price target for BBY is $125 and then, perhaps, higher.
BBY Potential Trade – Showing Strength
This signal could give a quick payout if it continues its upward move, and the strength of this pattern continues. It looks as if it could push above $125.
To buy shares of BBY would cost approximately $121 per share and if it reaches its near-term target of $125 that would be a gain of $4.
This is a great example of the benefits of trading options. Let’s discuss this as a study case.
Option trading offers the potential of a lower initial investment and higher percentage gain. Let’s take a look and make a comparison.
The plus DI (green line) is above the -DI and if it stays above the -DI (red) line and rises above 121 by Friday a call trade can be considered.
If you buy 5 shares of BBY at $121, you will invest $605. If the stock increases in price to $125, you will earn a profit of $4 per share or $20 for the 5 shares or about 3%.
If you bought one option contract covering 100 shares of BBY with a Sept 10th (Sept wk 2) expiration date for the $125 strike and premium would be approximately $1.63 today or $163 per 100 share contract. If price increased to the expected $125 target or a gain of $4 over the next few weeks, the premium would likely increase $2 to $3.63 ($2 x 100 share contract = $200 Profit.) $200 profit on your $163 investment, this is an 123% gain. Nice! Terrific trade if it hits it target!
Trading options is a win, win, win opportunity. Options often offer a smaller overall investment, covering more shares of stock and potential for greater profits.
I like to stress when trading options, you don’t need to wait for the expiration date to close the trade. You can close anywhere along the way prior to the expiration date. It is never a bad idea to take profit.
Trading options is like renting stocks for a fixed period of time. The potential to generate steady income with options is real and it can be transforming. Watch this video to learn how you can use option trading to achieve financial freedom. click here

Past Equity Candidates:
Two weeks ago, we looked at AIG with a Sept 3rd (Sept wk 1) expiration, a 56 strike and a premium of .57. Last week it went as high as .90 on Monday and is at .80 as I typed on Tuesday or a 44% gain. This week is it down to .45.
Last week, we discussed LOW with a Sept. 3rd (Sept wk 1) expiration, a 210 strike and a premium of 2.25. Last week it climbed as high as 209.49 (close to 210) and premium increased to 3.20 or an 87% profit. It is down in price to 205.76 as I type today.


Recent Comments