
Happy Thankful Tuesday!
I am excited to share that you don’t need special education or to sit in front of the computer all day to trade options. It can be easily learned if you are interested in spending an hour or so a week earning money in what could be considered “renting” stocks for a short period of time.
This is why I show you the details about an equity’s symbol and pattern each week.
I am typing this on Friday which was a half-day and before the new week starts. Last week, the Dow was down 2 days out of 4. There was a large drop on Friday that caused a breech in daily indicators, allowing EMAs to cross down which hasn’t been seen since September. Talk of new virus variant seems to be the main catalyst for the Dow’s drop.
For the updates on previously discussed symbols, please scroll down.
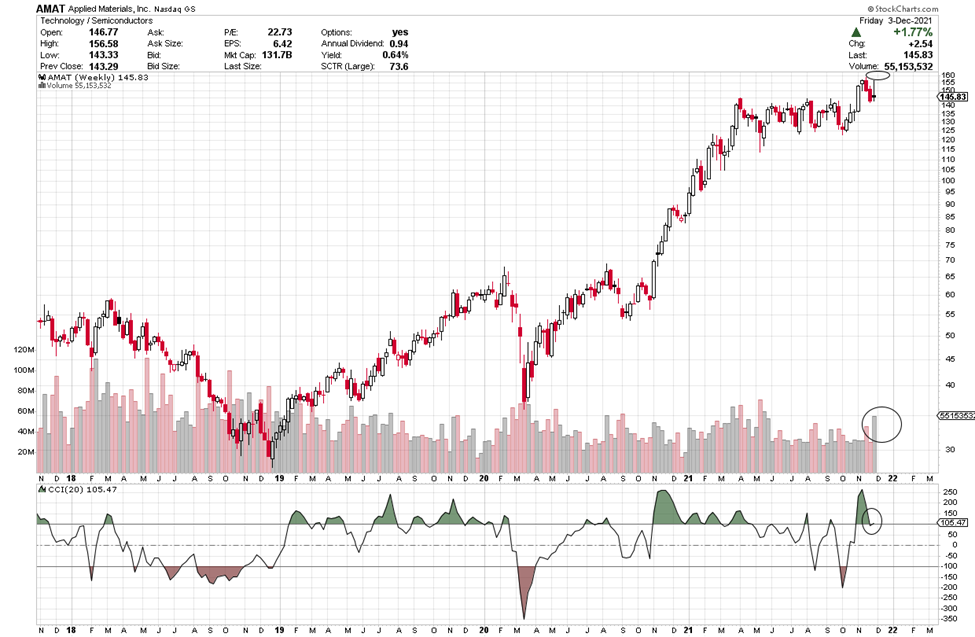
For today’s Trade of the Day, we will be looking at Applied Materials, Inc. (AMAT).
Before analyzing AMAT’s chart, let’s take a closer look at the company and its services.
Applied Materials, Inc. provides manufacturing equipment, services, and software to the semiconductor, display, and related industries. It operates through three segments: Semiconductor Systems, Applied Global Services, and Display and Adjacent Markets. The company operates in the United States, China, Korea, Taiwan, Japan, Southeast Asia, and Europe.
Applied Materials, Inc. was founded in 1967 and is headquartered in Santa Clara, California.
Each candle on the chart represents price movement over a 5-day (week) period. The indicator at the bottom of the chart is a Channel Commodity Index (CCI).
I drew a line below the candles, if price stays above that line, the upward trend should continue. Watch for a continued rise toward its target.

A cross down through the CCI zero or -100 line is bearish, in that it is suggesting price has gone from bearish to even more bearish. A cross up through the zero line and a cross through 100, suggests price is bullish. If you want to learn more about the CCI, you can read through the short section below or you can scroll down to the alert signal.
Channel Commodity Index
A cross up and over the CCI -100 or the zero line can issue an entry signal as it moves from being bearish to bullish. A rise toward 100 is a continuation of that bullishness. Up through the 100 line creates a green fin of bullishness, until it drops back down through the 100-line.
Also, a pullback and then, as it heads back up is another bullish indicator.
A break below the zero line means it has gone from bullish to bearish and a drop below -100 suggests even more bearishness.
The Commodity Channel Index (CCI) is a versatile indicator that can be used to identify a new trend or warn of extreme conditions. Originally, it was developed to identify cyclical turns in commodities, but the indicator can be successfully applied to indices, ETFs, stocks and other securities. In general, CCI measures the current price level relative to an average price level over a given period. CCI is relatively high when prices are far above their average but is relatively low when prices are far below their average. In this manner, CCI can be used to identify overbought and oversold levels or breaks from one level to another.
Check Out How This Rise in Price Could Pay Out Big Time
AMAT is bullish as it rises further up above the 100 line after a brief pullback. This week’s candle is apt to continue its upward movement that could take it higher. We are looking for a continued rise above $146 before considering entry and then higher. The target is $160 and then higher.
Potential Profit Play for AMAT
If AMAT’s price continues to move up, you could consider a Call trade. I am writing this on Sunday, if price continues to rise above 146 when you receive this on Tuesday, you could consider a call option trade. We are expecting the CCI indicator to continue rising further above the 100 line.
Price is currently at approximately $146 as I write over the weekend and is expected to continue heading up to perhaps, hit the target of $160 and then higher.
If price doesn’t stay above $145, don’t consider a trade.
These examples are listed as an example to show how options work and the advantages they offer.
If the CCI line stays above the 100 line and then, continues up, price will continue its current uptrend and continue to rise. We will keep an eye on it over the course of the next few weeks.
The short-term price target for AMAT is $160 and, perhaps, higher.
To buy shares of Applied Materials (AMAT) stock today, it would cost approximately $146 per share.
Option trading offers the potential of a lower initial investment and higher percentage gain. It is like renting stock versus buying out right. Let’s take a look.
If you bought 4 shares of AMAT at $146 total investment $584 and it increased in price to $160, it would result in a profit of $14 or $56 for the 4 shares or an 9% gain.
If you bought one Call option contract covering 100 shares of AMAT’s stock with a Dec 17 (Dec 21) expiration date for the 160-strike, the premium would be approximately $.97 per share or a total of $97 for the contract of 100 shares. If price increased the expected $14 over the next few weeks to $160 target, the premium would increase approximately $8 to $8.97. This is a gain of $800 or 824%% profit. That would be a nice trade over a short period of time!
It is exciting to make money if price rises or falls.
I want to remind you that you can sell to close and take profit any time along the line before the expiration date. You don’t have to hold the contract until expiration.
Options often offer a smaller overall investment, covering more shares of stock and potential for greater profits. This is like renting stocks versus having to pay full price to buy.
This said, if you are having any kind of trouble taking advantage of these trades, we don’t want you to miss out. I have put together programs that help traders just like you access the potential profits that options provide. Be sure to check out the programs shared in this email and we will make it easy for you to get your share.
I love to trade, and I love to teach. It is my thing.
Yours for a prosperous future,
Wendy Kirkland
PS-I have created this daily letter to help you see the great potential you can realize by trading options. Being able to recognize these set ups are a key first step in generating wealth with options. Once you are in a trade, there is a huge range of tools that can be used to manage the many possibilities that can present themselves. If you are interested in learning how to apply these tools and increase the potential of each trade, click here to learn more.
Previous Equities discuss:
Two weeks ago, we discussed JD and a Dec 10 (Dec wk 2), 95 strike with a 2.42 premium. On the 23rd, it rose as high as 2.75 and then, started dropping throughout the rest of the day and into the week. It happened so fast, likely there would have been no trade last week.
Last week, we talked about NVAX, I too dropped with the bearish market overall, so there would have been no trade.


Recent Comments