
by Kathy Lien
More often than not, traders will find themselves faced with a potential breakout scenario, position for it, and then only to end up seeing the trade fail miserably and have prices revert back to range trading. In fact, even if prices do manage to break out above a significant level, a continuation move is not guaranteed. If this level is very significant, we frequently see inter-bank dealers or other traders try to push prices beyond those levels momentarily in order to run stops. Breakout levels are very significant levels, and for this very reason there is no hard-and-fast rule as to how much force is needed to carry prices beyond levels into a sustainable trend.

Trading breakouts at key levels can involve a lot of risk and as a result, false breakout scenarios appear more frequently than actual breakout scenarios. Sometimes prices will test the resistance levels once, twice, or even three times before breaking out. This has fostered the development of a large contingent of contra-trend traders who look only to fade breakouts in the currency markets. Yet fading every breakout can also result in some significant losses because once a real breakout occurs, the trend is generally strong and long-lasting. So what this boils down to is that traders need a methodology for screening out consolidation patterns for trades that have a higher potential of resulting in a false breakout. The following rules provide a good basis for screening such trades. The fader strategy is a variation of the waiting for the real deal strategy. It uses the daily charts to identify the range-bound environment and the hourly charts to pinpoint entry levels.
Strategy Rules
Long
- Locate a currency pair whose 14-period ADX is less than 35. Ideally the ADX should also be trending downward, indicating that the trend is weakening further.
- Wait for the market to break below the previous day’s low by at least 15 pips.
- Place an entry order to buy 15 pips above the previous day’s high.
- After getting filled, place your initial stop no more than 30 pips away.
- Take profit on the position when prices increase by double your risk, or 60 pips.
Short
- Locate a currency pair whose 14-period ADX is less than 35. Ideally the ADX should also be trending downward, indicating that the trend is weakening further.
- Look for a move above the previous day’s high by at least 15 pips.
- Place an entry order to sell 15 pips below the previous days’ low.
- Once filled, place the initial protective stop no more than 30 pips above your entry.
- Take profits on the position when it runs 60 pips in your favor.
Further Optimization
The false breakout strategy works best when there are no significant economic data scheduled for release that could trigger sharp unexpected movements. For example, prices often consolidate ahead of the US non-farm payrolls release. Generally speaking, they are consolidating for a reason and that reason is because the market is undecided and is either positioned already or wants to wait to react following the release. Either way, there is a higher likelihood that any breakout on the back of the release would be a real one and not one that you want to fade. This strategy works best with currency pairs that are less volatile and have narrower trading ranges.
Example
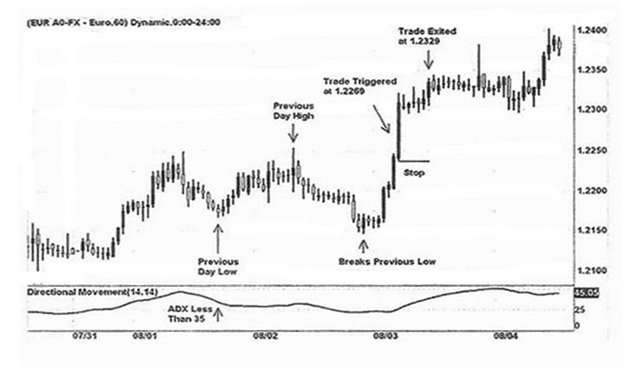
The chart below is an hourly chart of the EUR/USD. Applying the rules just given, we see that the 14-period ADX dips below 35, at which point we begin looking for prices to break below the previous days’ low of 1.2166 by 15 pips. Once that occurs, we look for a break back above the previous days’ high of 1.2254 by 15 pips, at which point we enter into a position at 1.2269. The stop is placed 30 pips below the entry price at 1.2239, with the limit exit order placed 60 pips above the entry at 1.2329. The exit order gets triggered a few hours later for a total profit of 60 pips with a risk of 30 pips.


Recent Comments