Happy Fabulous Friday!
I teach everyday people (like me) to trade options. I do my best to write in an understandable way as if we are talking over the kitchen table.
The market was down 3 out of 5 days last week. I am typing this on Wednesday, and you won’t get this until Friday. A lot can change in a couple days. S&P was up Monday and Tuesday but lost all of the gains on today (Wednesday).
For today’s Trade of the Day, we will be looking at Etsy Corporation, Symbol (ETSY).
Etsy, Inc. operates two-sided online marketplaces that connect buyers and sellers primarily in the United States, the United Kingdom, Germany, Canada, Australia, France, and India. Its online market places include Etsy.com and Reverb.com. The company offers approximately 85 million items in its various retail categories to buyers. Etsy, Inc. was founded in 2005 and is headquartered in Brooklyn, New York.
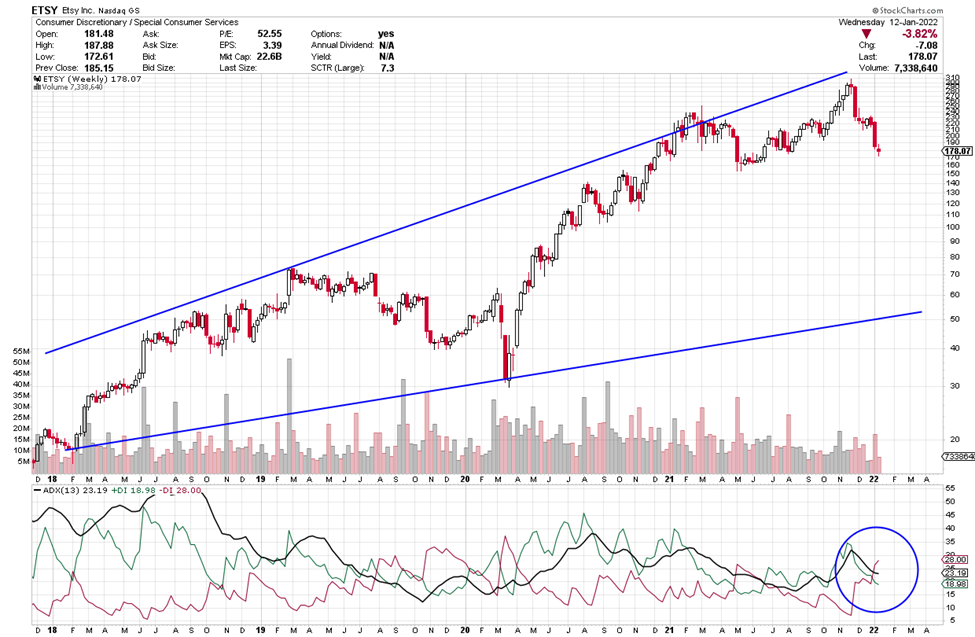
Let’s look at ETSY’s weekly chart.
The ADX -DI (red line) is above the +DI and the black ADX line is heading up. As long as the -DI is above the +DI, price should fall. Red above green is an indication of strength. When the -DI is bullish and the ADX turns up, it shows price is likely to fall. If you want to learn more about ADX, read on or, if not, scroll down to the alert.

Average Direction Index (ADX) – Strength Indicator
The Average Directional Index consists of 3 lines: Green, Red and Black.
Green = +DI (Bullish)
Red = -DI (Bearish)
Black = ADX Strength Line
The DI line that is on top is in control. If the ADX line is heading up, strength is supporting the DI line that is on top and in control.
Each candle on the chart represents price movement over a 5-day (week) period; therefore, it takes weeks for trades to play out. On the chart, the week is a bullish candle as I type. When the +DI crosses over the -DI line, it gives a buy signal (as the +DI line (green) appears as if it is in control and rising to head up on the ADX indicator, and as the ADX turns up that is even more bullish, suggesting an upward move is gaining strength. I’d like to see the green line to continue its upward bias and then the black line to turn straight up and head up as well. All are bullish signs of strength. When the +DI crosses the ADX (black line) and when it rises, it shows a new burst of strength coming into the equity.
ETSY Potential Trade – Showing Strength
This signal could give a quick payout if it continues its downward move, and the strength of this pattern continues. I am typing this on Wednesday and ETSY ended the day at $178. If ETSY’s price moves below $178 and the – DI (red line) is above the +DI with the black line heading up you could consider a Put trade. The short-term price target for ETSY is $175 and then, perhaps, lower. With the swings in past months, I am suggesting small profit targets until a market trend starts again.
Option trading offers the potential of a lower initial investment and higher percentage gain. Let’s take a look and make a comparison.
It would be silly to buy shares of ETSY if you expect the price to go down. With options, you can profit even when the market goes down.
If you bought 1 Put option covering 100 shares of ETSY with a Jan 28th (Jan wk4) expiration date for the 175 strike the premium would be approximately $6.60 today or $660 for 1 option. If price fell to $170 over the next few weeks, the premium would likely increase $2.50 giving $250 profit on your $660 investment, this is an 38% gain. A nice profit even with the market going down.
Trading options is a win, win, win opportunity. Options often offer a smaller overall investment, covering more shares of stock and potential for greater profits.
I like to stress when trading options, you don’t need to wait for the expiration date to close the trade. You can close anywhere along the way prior to the expiration date. It is never a bad idea to take profit.
Trading options is like renting stocks for a fixed period of time. The potential to generate steady income with options is real and it can be transforming. Watch this video to learn how you can use option trading to achieve financial freedom. click here
Yours for a prosperous future,
Wendy Kirkland

Past Equity Candidates: We looked at INTC Jan 21st 57 strike last week. Buying at .27 you could have sold Tuesday for .41 a 52% profit. We will continue to watch this trade.


Recent Comments