
Is the market starting a new trend? How will earnings impact the potential trend? Is this the end of the concern over inflation?
We have questions, and the market is starting to answer! Technology seems to be breaking out to a new bull trend, and earnings season is underway, which can give that fundamental boost that helps accelerate a new trend. Or it can be the fundamental input that ends it. And all the while, we’re getting data on inflation that seems a bit less worrisome, so perhaps rate hikes can slow and give a tailwind to a bull trend. It’s an interesting time with interesting inputs and so, for me, it’s time to evaluate what the technical indicators are saying.
The first thing that I want to do is to recap an idea from last week and give an update on how it could be played right now. That was in PLUG:


In PLUG, the market had just crossed the 100-Day Moving Average which has been a key momentum indicator recently. However, over the last 3 trading days, it has struggled with the 200-Day Moving Average. Is ~15% enough in a week or is this a simple stall before the next big leg higher? For me, if this stock can’t break through the 200-Day Moving Average in the coming days, it could be the end of its move. And if it can break through, that could set up another big leg to the upside, so it’s still a stock to watch.
But there’s more than just PLUG to look at right now. With earnings getting started, we’ve seen many financial stocks outperforming market expectations. Let’s take a simple look at XLF, a Financial Sectors ETF, to see how the performance has been with earnings getting started:
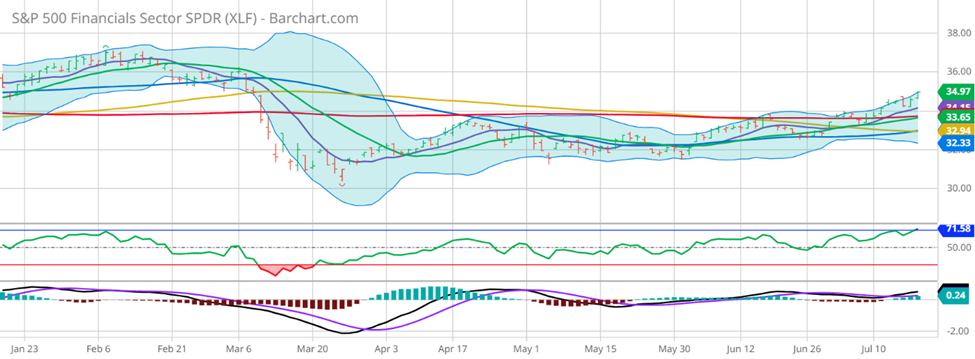
XLF is just starting to breakout thanks to the positive fundamental input. Investors are sure to take notice as the risk of a financial company position seems lessened thanks to the earnings these companies are reporting.
So, one must wonder, how could I possibly take advantage of this increased profit in financial companies at the beginning of the earnings cycle while controlling risk and adding the leverage of options? Well, of course, the answer should be to look at the power of the Outlier Watch List that I put out every week. One name from my Outlier Watch List this week was PACW, which got hit hard during the banking crisis of the past few months that took out a handful of smaller banks:


As you can see, PACW is approaching recent highs while also getting awfully close to that key 100-Day Moving Average that we’ve seen as a trigger point for the past few weeks. This is a name I’m watching closely, and it was on my Outlier Watch List this past weekend as a potentially explosive setup. While there will certainly be more explosive setups on my next list, this is one to watch in the coming days!
By combining the leverage of options with a strong technical signal, it’s clear that there’s a significant beneficial risk/reward profile in many of the stocks I’m watching and trading.
So please go to http://optionhotline.com to review how I traditionally apply technical signals, volatility analysis, and probability analysis to my options trades. As always, if you have any questions, never hesitate to reach out.
Keith Harwood
Keith@optionhotline.com


Recent Comments