
Dear Reader,
Yesterday we looked at a Daily Price Chart of OXY, noting that the stock was trading below the upper Keltner Channel making it a good time to enter.
For today’s Trade of the Day e-letter we will be looking at a daily chart for Stride Inc., stock symbol: LRN.
Before breaking down LRN’s monthly chart let’s first review what products and services the company offers.
Stride Inc. is a technology-based education company, provides proprietary and third-party online curriculum, software systems, and educational services to facilitate individualized learning for students primarily in kindergarten through 12th grade (K-12) in the United States and internationally.
Confirming a Price Uptrend with OBV
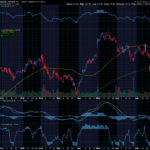
The LRN daily price chart below shows that LRN is in a price uptrend as the current price is above the price LRN traded at 1 year ago. The On Balance Volume chart is below the daily chart.
On Balance Volume measures volume flow with a single Easy-to-Read Line. Volume flow precedes price movement and helps sustain the price downtrend. When a stock closes up, volume is added to the line. When a stock closes down, volume is subtracted from the line. A cumulative total of these additions and subtractions form the OBV line.
On Balance Volume Indicator
● When Close is Up, Volume is Added
● When Close is Down, Volume is Subtracted
● A Cumulative Total of Additions and Subtractions form the OBV Line
Volume flow precedes price and is the key to measuring the validity and sustainability of a price trend.
We can see from the OBV chart below that the On Balance Volume line for LRN is sloping up. An up-sloping line indicates that the volume is heavier on up days and buying pressure is exceeding selling pressure. Buying pressure must continue to exceed selling pressure in order to sustain a price uptrend. So, On Balance Volume is a simple indicator to use that confirms the price uptrend and its sustainability.
The numerical value of the On Balance Volume line is not important. We simply want to see an up-sloping line to confirm a price uptrend.

Profit if LRN is Up, Down or Flat
Since LRN’s OBV line is sloping up, the most likely future price movement for LRN is up, making LRN a good candidate for a stock purchase or a call option spread.
Let’s use the Hughes Optioneering calculator to look at the potential returns for an LRN debit spread.
The Call Option Spread Calculator will calculate the profit/loss potential for a call option spread based on the price change of the underlying stock/ETF at option expiration in this example from a 7.5% increase to a 7.5% decrease in LRN at option expiration.
The goal of this example is to demonstrate the ‘built in’ profit potential for option spreads and the ability of spreads to profit if the underlying stock is up, down or flat at option expiration. Out of fairness to our paid option service subscribers we don’t list the option strike prices used in the profit/loss calculation.
The prices and returns represented below were calculated based on the current stock and option pricing for LRN on 7/28/2022 before commissions.

Built in Profit Potential
For this option spread, the calculator analysis below reveals the cost of the spread is $625 (circled). The maximum risk for an option spread is the cost of the spread.
The analysis reveals that if LRN decreases 2.5%, is flat, or is up at all at expiration the spread will realize a 44% or $275 return (circled). If LRN decreases -5% at expiration we will profit 42% or $263.
And if LRN decreases 7.5% at option expiration, the option spread would still make a 24.4% or $152 return (circled).
Due to option pricing characteristics, this option spread has a ‘built in’ 44% profit potential when the trade was initiated*.
Option spread trades can result in a higher percentage of winning trades compared to a directional option trade if you can profit when the underlying stock/ETF is up, down or flat.
A higher percentage of winning trades can give you the discipline needed to become a successful trader.
The Hughes Optioneering Team is here to help you identify winning trades just like this one.

Interested in accessing the Optioneering Calculators? Join one of Chuck‘s Trading Services for unlimited access! The Optioneering Team has option calculators for six different option strategies that allow you to calculate the profit potential for an option trade before you take the trade.
Trade High Priced Stocks for $350 With Less Risk
One of the big advantages to trading option spreads is that spreads allow you to trade high price stocks like Amazon, Google, Microsoft or Apple for as little as $350. With an option spread you can control 100 shares of Microsoft for $350. If you were to purchase 100 shares of Microsoft at current prices it would cost about $27,000. With the stock purchase you are risking $27,000 but with a Microsoft option spread that costs $350 your maximum risk is $350 so your dollar risk is lower with option spreads compared to stock purchases.
Get Trade Insights Directly From Chuck
You can start getting market insights directly from 10-Time Trading Champion Chuck Hughes.
See what he’s trading and when with his exclusive Inner Circle Trading Service where he will send you his hand-picked stock and option trades.
Just call Brad at 1-866-661-5664 or 1-310-647-5664 to join or CLICK HERE to schedule a call!
Wishing You the Best in Investing Success,

Chuck Hughes
Editor, Trade of the Day
Have any questions? Email us at dailytrade@chuckstod.com
*Trading incurs risk and some people lose money trading.


Recent Comments