Everyone has been looking for the sign that this is, in fact, a bottom. The NASDAQ chart is about to provide a very strong clue.
The simple sign of a bottom is to see higher highs and higher lows. If it were only that simple. The context around a trend also has to be there to really support the trend and allow it to sustain and generate more momentum. Right after the COVID crash a couple years ago, it looked like the rebound was just a bounce. It was very easy to point to a long list of ways to defend that there was going to be an even bigger drop. Then we spent a year and a half in an epic bull market.
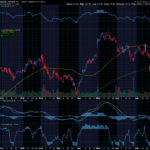
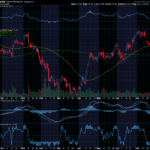
It is easy now to say that all of the conditions affecting the economy should be a strong reason the market won’t be able to pull off a reversal, but in the end, the charts don’t lie. Take a look:

It made a run at a reversal at the beginning of June only to plummet a week or so later. Then it fought back and broke through resistance (the green line above). Now we see it pushing for the next recent high from that run in made at the beginning of June. 12,300 looks to be the next key point that will show if there is enough momentum to keep this going. Since tech is often the leading index to show market shifts, this is important to keep your eye on. Remember, just like after the COVID crash it doesn’t feel like a true bottom till you are looking back at it on a chart months later.
Joe Duffy shares some amazing strategies for determining true momentum and determined how strong it is in his free book. This is a great time to grab it and take a look at how he does it.
Keep learning and trade wisely,
John Boyer
Editor
Market Wealth Daily


Recent Comments