
Happy Financial Freedom Friday!
My goal is to strive to be and remain in the present moment. Sure, I am looking at charts and thinking about what is likely to happen next, but I am still consciously aware that chart reading is what I choose to do in this moment. I am not lost in the past or treading water in the future.
What’s most important, is that I am here right now, doing what I chose to do. Much less important is what I am expected to do, when, where and with whom, unless it is exactly what I choose to do now.
Remember, be in the moment! Figuring out why you here is not nearly as important as just honoring that it was a phenomenally good idea.
Here’s What Is Covered Below:
- What are Bollinger Bands
- What information are they sharing
- How do you apply that information
- Using to trade
Today, we are going to discuss Bollinger Bands and apply them to a chart. This indicator is available on Stockcharts.com, which is a service we discussed last week. It is a service I have used for years for charting. Bollinger Bands will also likely we available on other chart services or on the charts your broker provides.
Stockcharts.com offers an amazing amount of free educational services. I will post a link below.
https://stockcharts.com/search/?q=bollinger++bands§ion=cs
The first listed heading provides information about Bollinger Bands and how that information is used when applied to a chart.
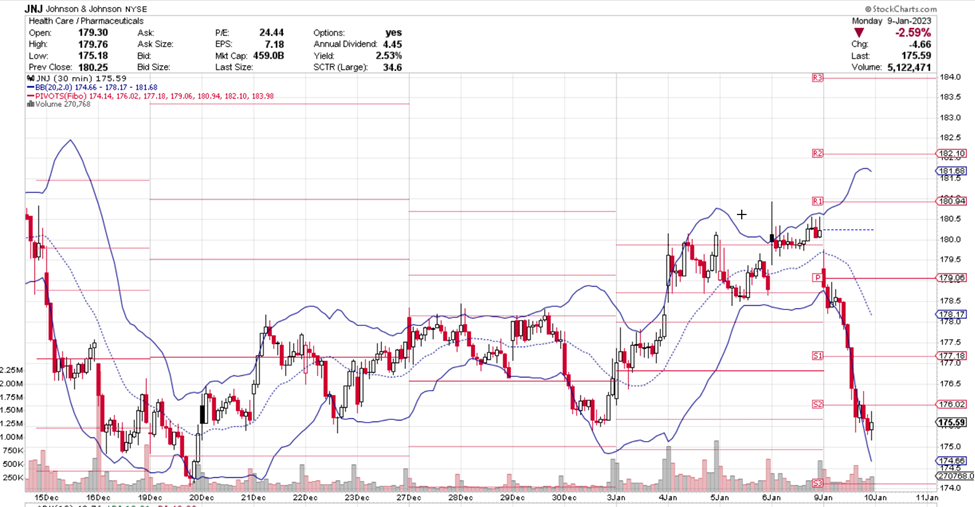
I will post an image of a chart and in general terms explain what the indicator is telling us.


It is important to realize you don’t need to absorb and understand all of this information at once, but it gives you the opportunity to zero in on the areas that you are interested in and would like to understand better.
So, let’s look closer at Bollinger Bands. The lines share information about volatility, which is often caused by news, earnings, price changes, etc. Bollinger Bands have three lines: the upper, dotted middle line and lower line.
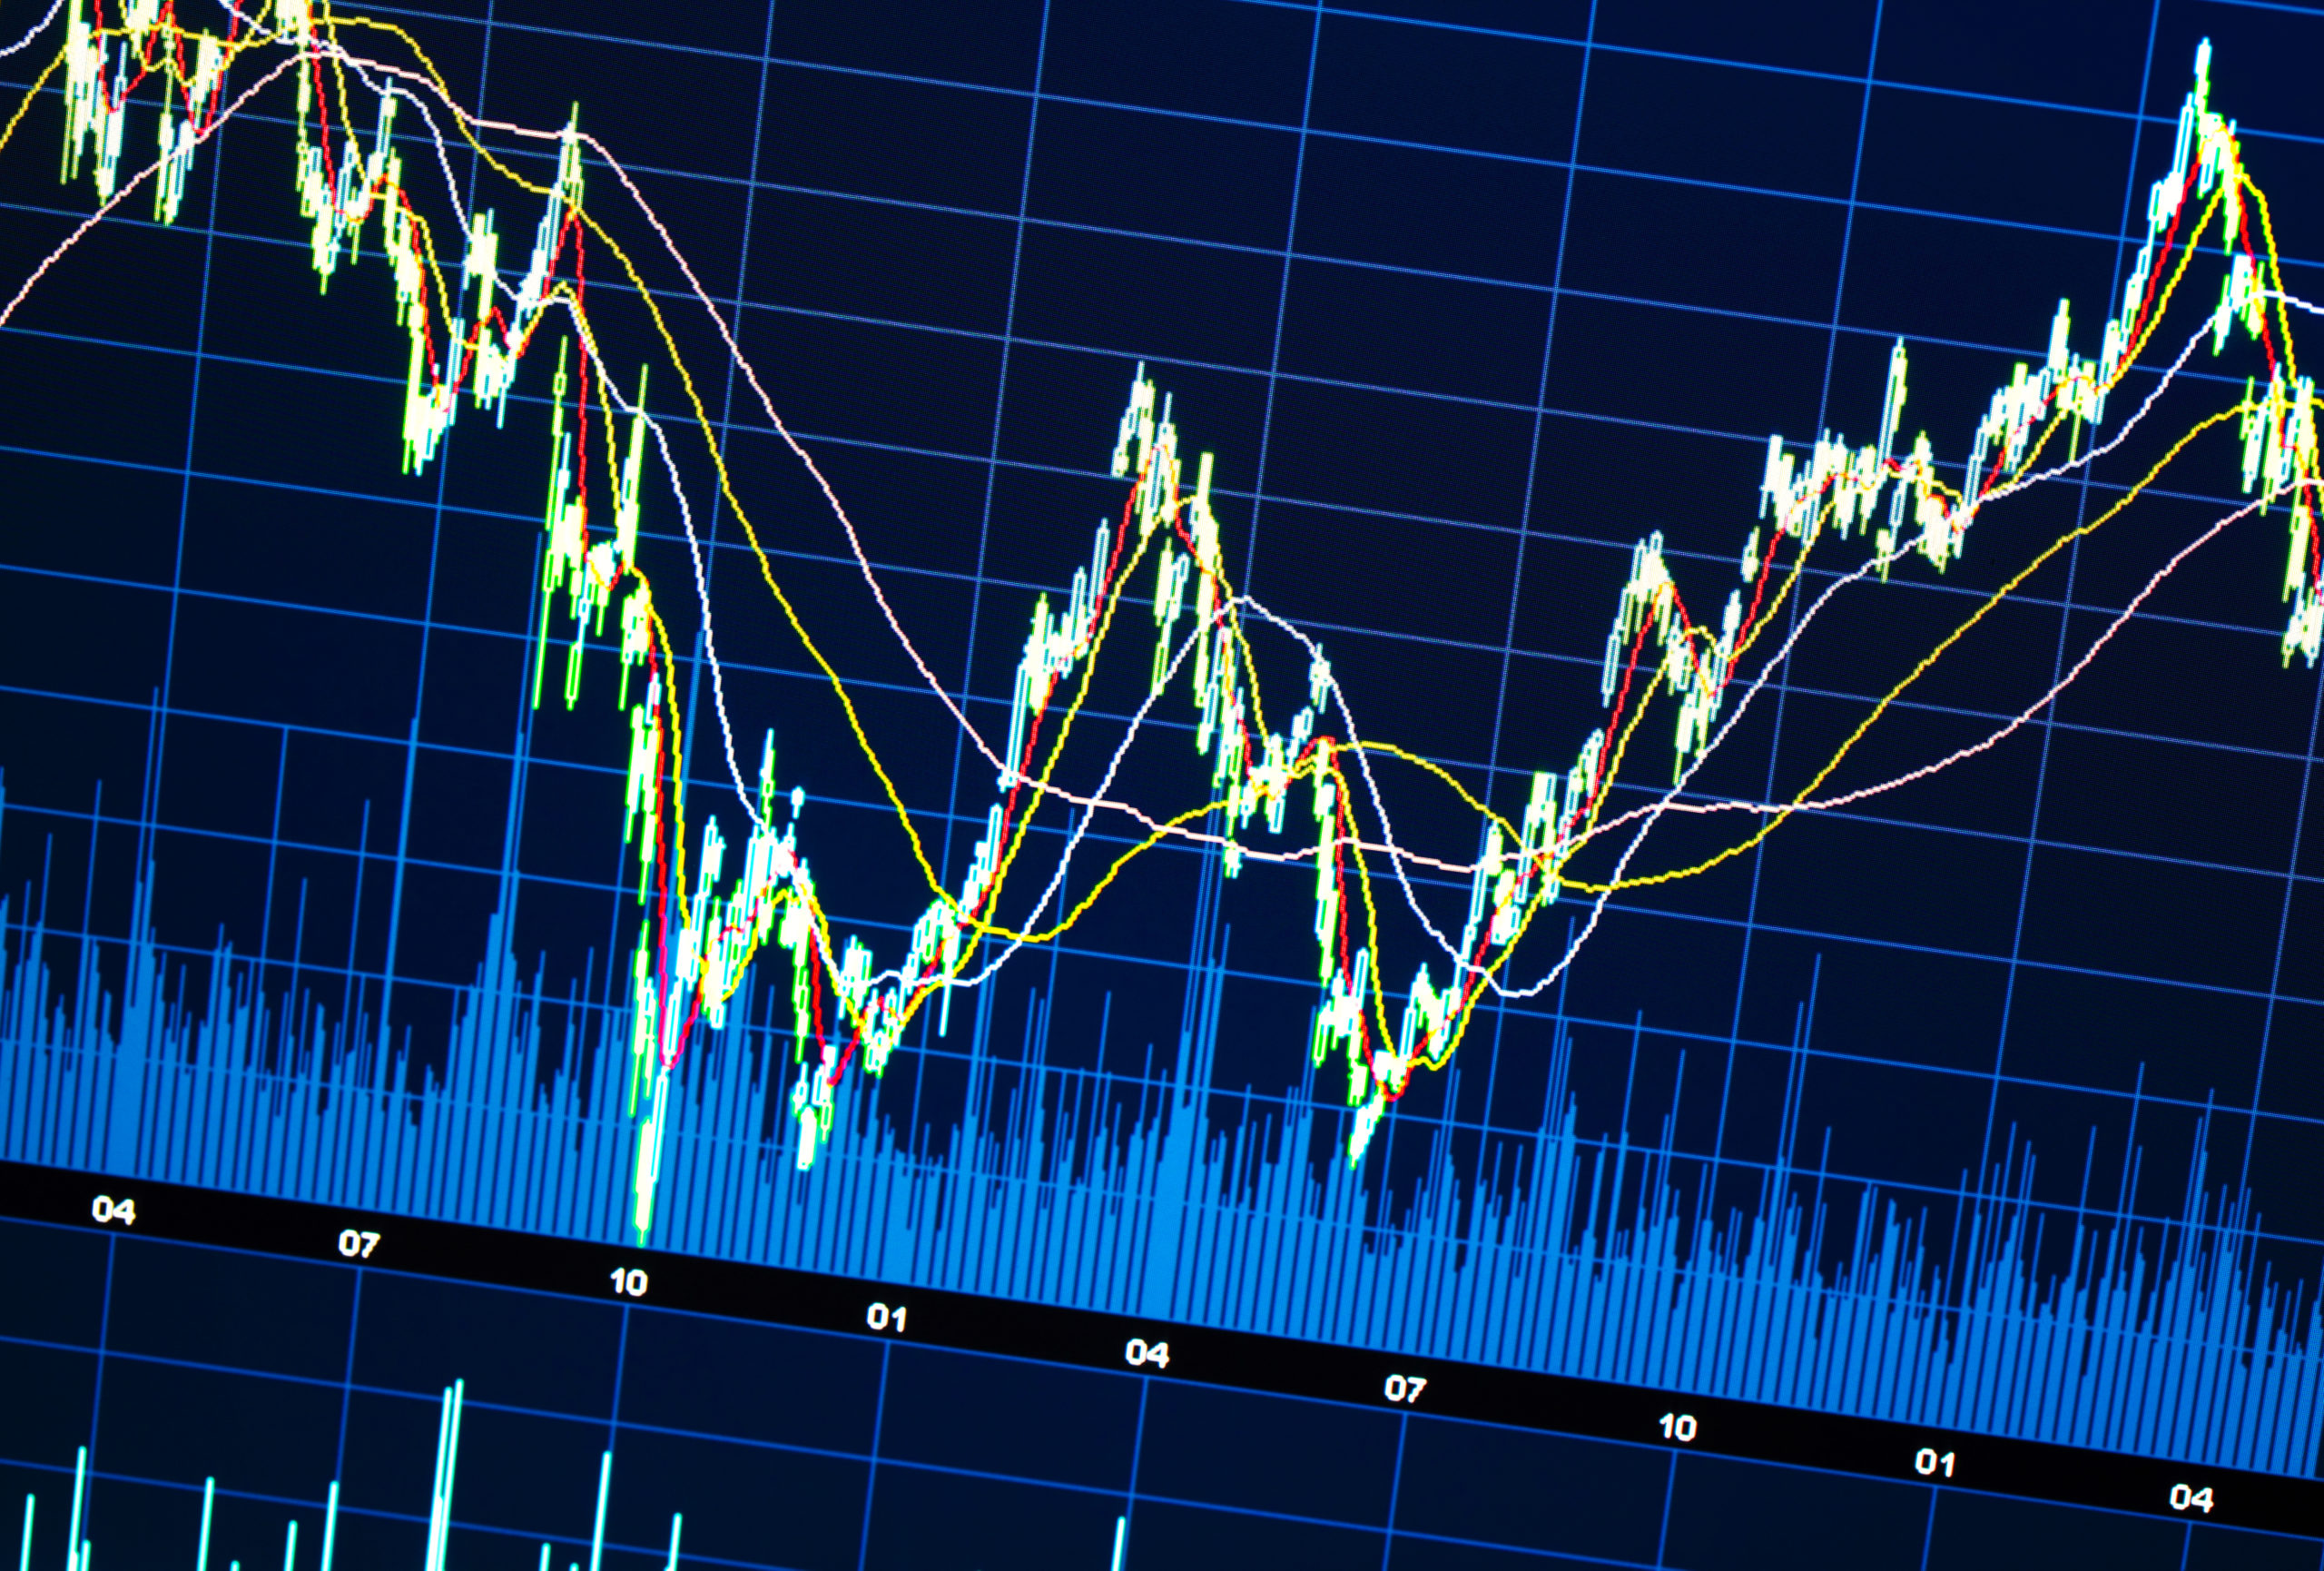
When the lines rise and price moves upward into the top portion of the Bands (above the dotted line), there is buying. Look at March, June through August, and October into November. This would be a time to buy call options. Also, notice the times that the Bands drop, and price moves into the lower portion on the Bands. This would be a time to buy Put options.
Often traders will use a cross above or below the dotted line as a signal for a possible trade entry. Of course, they are likely to use additional indicators as well, and the Bollinger Bands are a confirmation.
Bollinger Bands can be applied to different time frame charts. I will post a 30-minute chart below. I am aware of traders using the Bands on their day-trade charts of even shorter time frames.
You can apply Bollinger Bands to your chart set up and then study price movement on how the line squeeze together or widen and see if they confirm and support other indicators that you are currently using.
Friday is education day. My goal is to teach everyday people (like me) to successfully trade options. I do my best to write in an understandable way as if we are talking while sitting on the deck of my house in a relaxed atmosphere.
The trading tools you select, and use are important, and can make your trading easier and more effective.
Everyday think of small things that make you happy and that bring you joy, and then, consciously treat yourself to those things. Take a break midday, fix a cup of tea, and go for a short walk while you sip and savor the tea. Or go play with your dog and enjoy nature. You can do art or take time for a hobby. Call a friend.
Intentionally treat yourself to happiness and smile often!
Have a great weekend.
And I wish you the very best,
Wendy


Recent Comments