
YETI Holdings, Inc. (YETI) appeared on our list of compressed stocks this morning. If you’ve been with us for a while, you may have seen YETI as a trending stock twice in this service. In both cases, YETI share prices were compressed and the stock made big moves shortly after the compression signal.
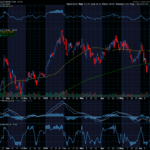
This first chart shows what happened after the first compression signal on November 28th, 2023. You can see in the chart below that the stock price started moving up and quickly moved outside of the ODDS Probability Cones. The stock then pulled back inside the cones. If you bought the straddle, which is our favorite non-directional strategy for compressed stocks, you may have taken profits by selling your calls. This is an exit strategy we frequently teach in our ODDS Online Coaching session. We will cover this again in tomorrow’s session at 2:00 pm ET for any of you that are new or if you need a refresher on the method.


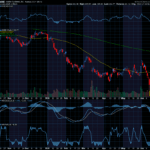
The second time we noted a compression signal in YETI was just last month on August 8th, 2024. The stock prices were compressed, and options were relatively cheap right before an earnings report. In this instance, we showed you a table of the behavior of YETI around earnings. We showed you how YETI tends to make big moves right after the announcements.
YETI did not disappoint. The very next day the stock jumped outside of the ODDS Probability Cones. Once again, the stock pulled back to the middle after the quick pop.

YETI share prices are compressed again, and the options expiring on October 18th are relatively inexpensive. As we learned in the previous compression signals, YETI tends to make a big move outside the ODDS Probability Cones, then it pulls back inside before expiration. This time there is not an earnings report before the target expiration.
If you implement a straddle based on today’s compression signal, you may want to take profits quickly if the stock moves outside of the cones. We will show you how we monitor the stock using the ODDS Probability Cones in tomorrow’s ODDS Online Coaching session.

This Volatility Term Structure chart for YETI shows us the implied volatility for the at-the-money options for each expiration. This chart shows that options expiring on October 18th have the lowest volatility expectations. You can also see the next expiration in November has the highest volatility expectations. That is because options investors are anticipating the potential for a big move in the stock price around earnings in November.
As you can see from the first YETI compression signal on page 2, the stock proved that it does not need an earnings report as a catalyst to make a big move.

This MDM graph compares the modeled expected distribution for future stock prices (the orange line) with the actual distribution of YETI’s share prices over the past year (the blue histogram). You can see that the actual stock movement shows that YETI tends to make big moves much more frequently than current options prices expect. This tells us that YETI options expiring on October 18th are relatively cheap. This is an option buying situation.

YETI share prices are compressed. The stock has a history of making big moves quickly after a compression signal. Options prices for the October 18th expiration are relatively cheap. The last two signals led to large moves that caused long straddle trades to quickly move into profitable territory. That history warrants another attempt for option buying strategies.
To get the specific details and prices on today’s trade ideas, be sure to read today’s ODDS Online Daily Option Trade Idea.

To access Odds Online Daily and be able to see any stock you are tracking in this software, click here.
Thank you,
Don Fishback


Recent Comments