
Getting ahead of a shift in direction can be extremely lucrative.
Higher highs matter.
Higher lows matter.
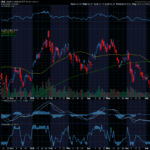
There are many momentum signals that I use frequently – but one of my favorite changing momentum signals is when the market is falling, but then it stops. And to know when it stops and the momentum is then turning higher (rather than simply stopping), I look for a higher high than the prior day and a higher low than the prior day.
Many of you have likely heard me refer to this over time, and probably don’t have a good sense as to why I like this as a technical indicator that things are changing, so I’d like to explain the reason that I like both parts, but I also need BOTH parts, to give me that indication that momentum hasn’t just stopped to the downside, but also may be turning back to the upside.
First, let’s see a visual representation recently in AAPL, and what we are looking to see happen coming out of that formation:

The Higher Low, and What It Means
The higher low, from the buyer’s perspective, simply means that they don’t have to stop out of their position. When someone is trying to buy near lows, they often set a stop-loss at the prior low, so if a new low is not made, they don’t stop out, and this means that there is no selling pressure from someone currently long the stock.
The higher low, from a seller’s perspective, means that there’s no significant new sellers helping push the momentum in that direction. This means that if someone is bearish and trying to sell this stock to push it lower, they are now seeing support to the stock, which is the opposite of their bias.
The Higher High, and What It Means
The higher high, from the buyer’s perspective, means that there are now not just buyers below the prior day’s market prices, or at the prior day’s market prices, but now ABOVE the prior day’s market prices. Investors see value here and think that the market has gone too far. This means that they are now finding value above the price that the buyer recently found value and confirming the bias. And, more importantly, the buyer is starting to make money. This is bullish.
The higher high, from the seller’s perspective, is also telling them that other sellers may be exiting their positions as they start to see that the bearish biased trade is played out. It’s gone too far, too fast, or might simply be done with all together. At the very least, the bearish trade is over for the short-term. The bear isn’t making money today. This is what we often refer to as “anti-bearish”. It can cause other shorts to start covering their bearish positions.
At the end of the day, sometimes these combinations simply turn into a false signal, and that’s why I always like combining my technical signals with options. When I’m right, I get leverage, and when I’m wrong, I define my risk.
So, please go to http://optionhotline.com to review how I traditionally apply technical signals and probability analysis to my options trades. As always, if you have any questions, never hesitate to reach out.
Keith Harwood
Keith@optionhotline.com


Recent Comments