
Dear Reader,
Yesterday, we looked at a Daily Price Chart of PayPal Holdings, Inc. noting that the stock’s 50-Day EMA is trading below the 100-Day EMA signaling a ‘Sell’.
For today’s Trade of the Day we will be looking at an On Balance Volume chart for Avalonbay Communities, Inc. stock symbol: AVB.
Before breaking down AVB’s OBV chart let’s first review which products and services are offered by the company.
Avalonbay Communities, Inc. owns or holds a direct or indirect ownership interest in 291 apartment communities containing 86,025 apartment homes in 11 states and the District of Columbia, of which 18 communities were under development and one community was under redevelopment. The Company is an equity REIT in the business of developing, redeveloping, acquiring and managing apartment communities.
Confirming a Price Downtrend with OBV
The AVB daily price chart below shows that AVB is in a price downtrend as the current price is below the price AVB traded at five months ago (circled). The On Balance Volume chart is below the daily chart.
On Balance Volume measures volume flow with a single Easy-to-Read Line. Volume flow precedes price movement and helps sustain the price downtrend. When a stock closes up, volume is added to the line. When a stock closes down, volume is subtracted from the line. A cumulative total of these additions and subtractions form the OBV line.
On Balance Volume Indicator
● When Close is Up, Volume is Added
● When Close is Down, Volume is Subtracted
● A Cumulative Total of Additions and Subtractions form the OBV Line
Volume flow precedes price and is the key to measuring the validity and sustainability of a price trend.
We can see from the OBV chart below that the On Balance Volume line for AVB is sloping down. A down-sloping line indicates that the volume is heavier on down days and selling pressure is exceeding buying pressure. Selling pressure must continue to exceed buying pressure in order to sustain a price downtrend. So, On Balance Volume is a simple indicator to use that confirms the price downtrend and its sustainability.
The numerical value of the On Balance Volume line is not important. We simply want to see a down-sloping line to confirm a price downtrend.
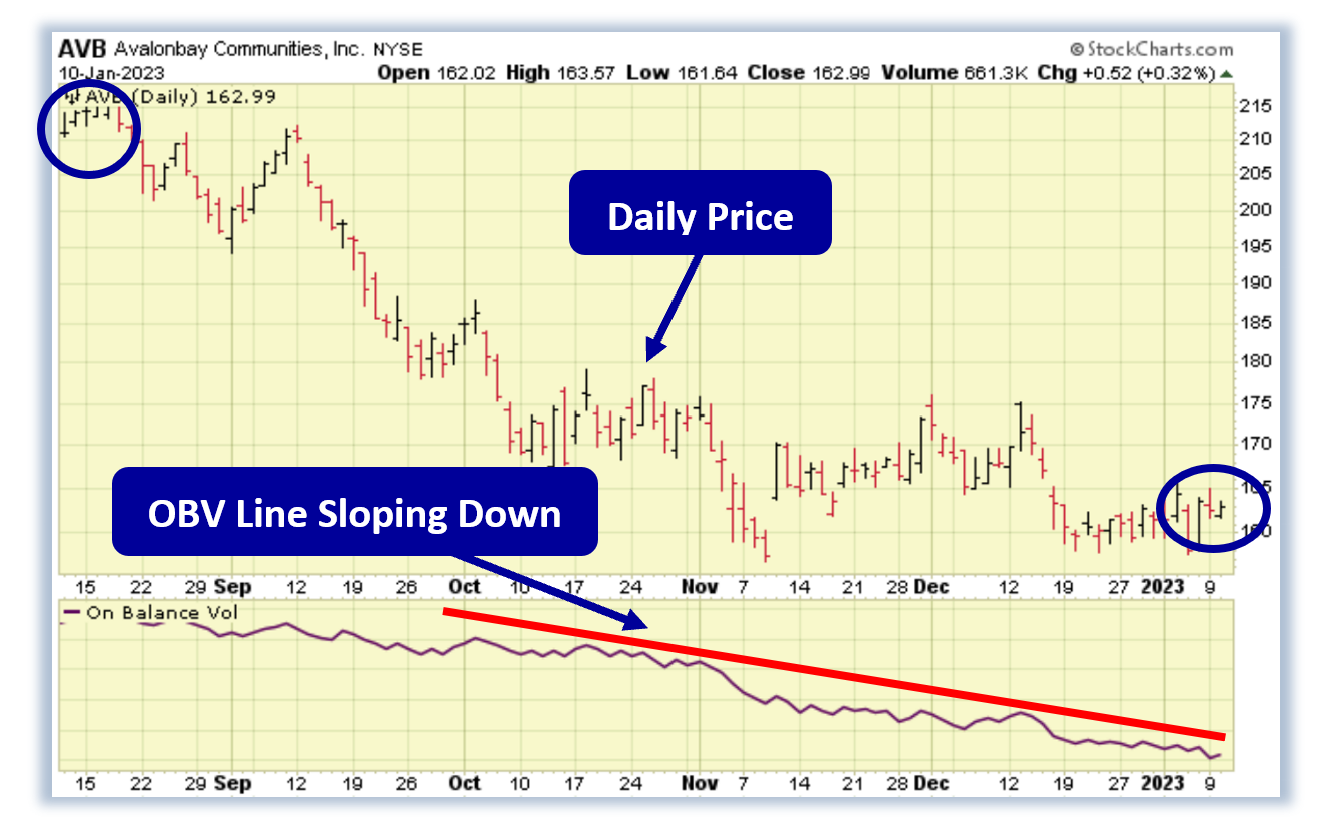
Confirmed ‘Sell’ Signal for AVB
Since AVB’s OBV line is sloping down, the most likely future price movement for AVB is down, making AVB a good candidate for a put option purchase.
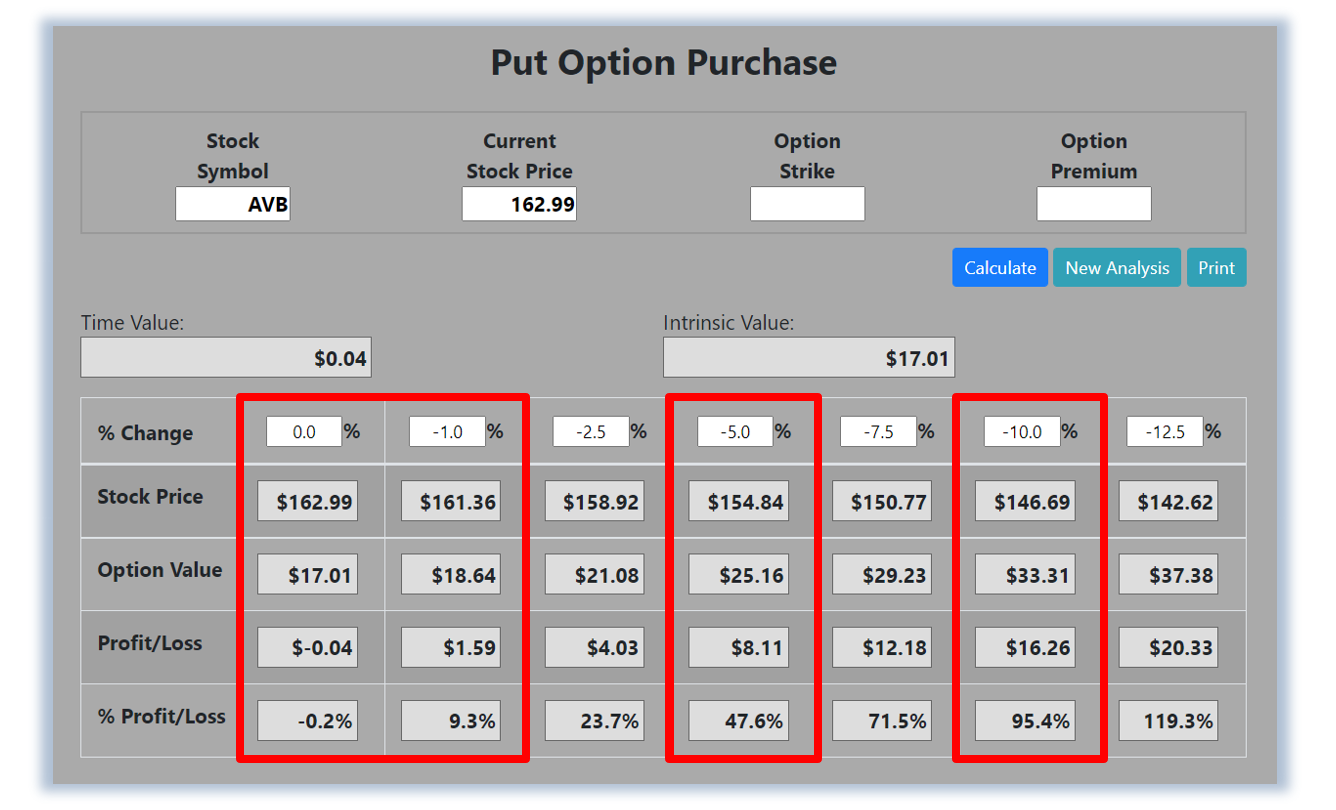
Let’s use the Hughes Optioneering calculator to look at the potential returns for an AVB put option purchase.
The Put Option Calculator will calculate the profit/loss potential for a put option trade based on the price change of the underlying stock/ETF at option expiration in this example from a flat AVB price to a 12.5% decrease.
The Optioneering Team uses the 1% Rule to select an option strike price with a higher percentage of winning trades. In the following AVB option example, we used the 1% Rule to select the AVB option strike price but out of fairness to our paid option service subscribers we don’t list the strike price used in the profit/loss calculation.

Trade with Higher Accuracy
When you use the 1% Rule to select an AVB in-the-money option strike price, AVB stock only has to decrease 1% for the option to breakeven and start profiting! Remember, if you purchase an at-the-money or out-of-the-money put option and the underlying stock closes flat at option expiration it will result in a 100% loss for your option trade! In this example, if AVB stock is flat at 162.99 at option expiration, it will only result in a 0.2% loss for the AVB option compared to a 100% loss for an at-the-money or out-of-the-money put option.
Using the 1% Rule to select an option strike price can result in a higher percentage of winning trades compared to at-the-money or out-of-the-money put options. This higher accuracy can give you the discipline needed to become a successful option trader and can help avoid 100% losses when trading options.
The goal of this example is to demonstrate the powerful profit potential available from trading options compared to stocks.
The prices and returns represented below were calculated based on the current stock and option pricing for AVB on 1/10/2023 before commissions.
When you purchase a put option, there is virtually no limit on the profit potential of the put if the underlying stock continues to decline in price.
For this specific put option, the calculator analysis below reveals if AVB stock decreases 5.0% at option expiration to 154.84 (circled), the put option would make 47.6% before commission.
If AVB stock decreases 10.0% at option expiration to 146.69 (circled), the put option would make 95.4% before commission*.
The leverage provided by put options allows you to maximize potential returns on bearish stocks.
The Hughes Optioneering Team is here to help you identify profit opportunities just like this one.
Interested in accessing the Optioneering Calculators? Join one of Chuck’s Trading Services for unlimited access! The Optioneering Team has option calculators for six different option strategies that allow you to calculate the profit potential for an option trade before you take the trade.
Get Trade Insights Directly From Chuck
You can start getting market insights directly from 10-Time Trading Champion Chuck Hughes.
See what he’s trading and when with his exclusive Inner Circle Trading Service where he will send you his hand-picked stock and option trades.
Just call Brad at 1-866-661-5664 or 1-310-647-5664 to join or CLICK HERE to schedule a call!
Wishing You the Best in Investing Success,

Chuck Hughes
Editor, Trade of the Day
Have any questions? Email us at dailytrade@chuckstod.com
*Trading incurs risk and some people lose money trading.


Recent Comments