
When we see this bobbling trend it can be very easy to get faked out. It can look like we have finally found support and now is the time to scoop up some great bargains as they recover. But, it can also be a dead cat bounce on the way farther down the trend.
Hold on to your shorts (pun absolutely intended) and keep an eye on the indicators that reveal what is going on with this trend.
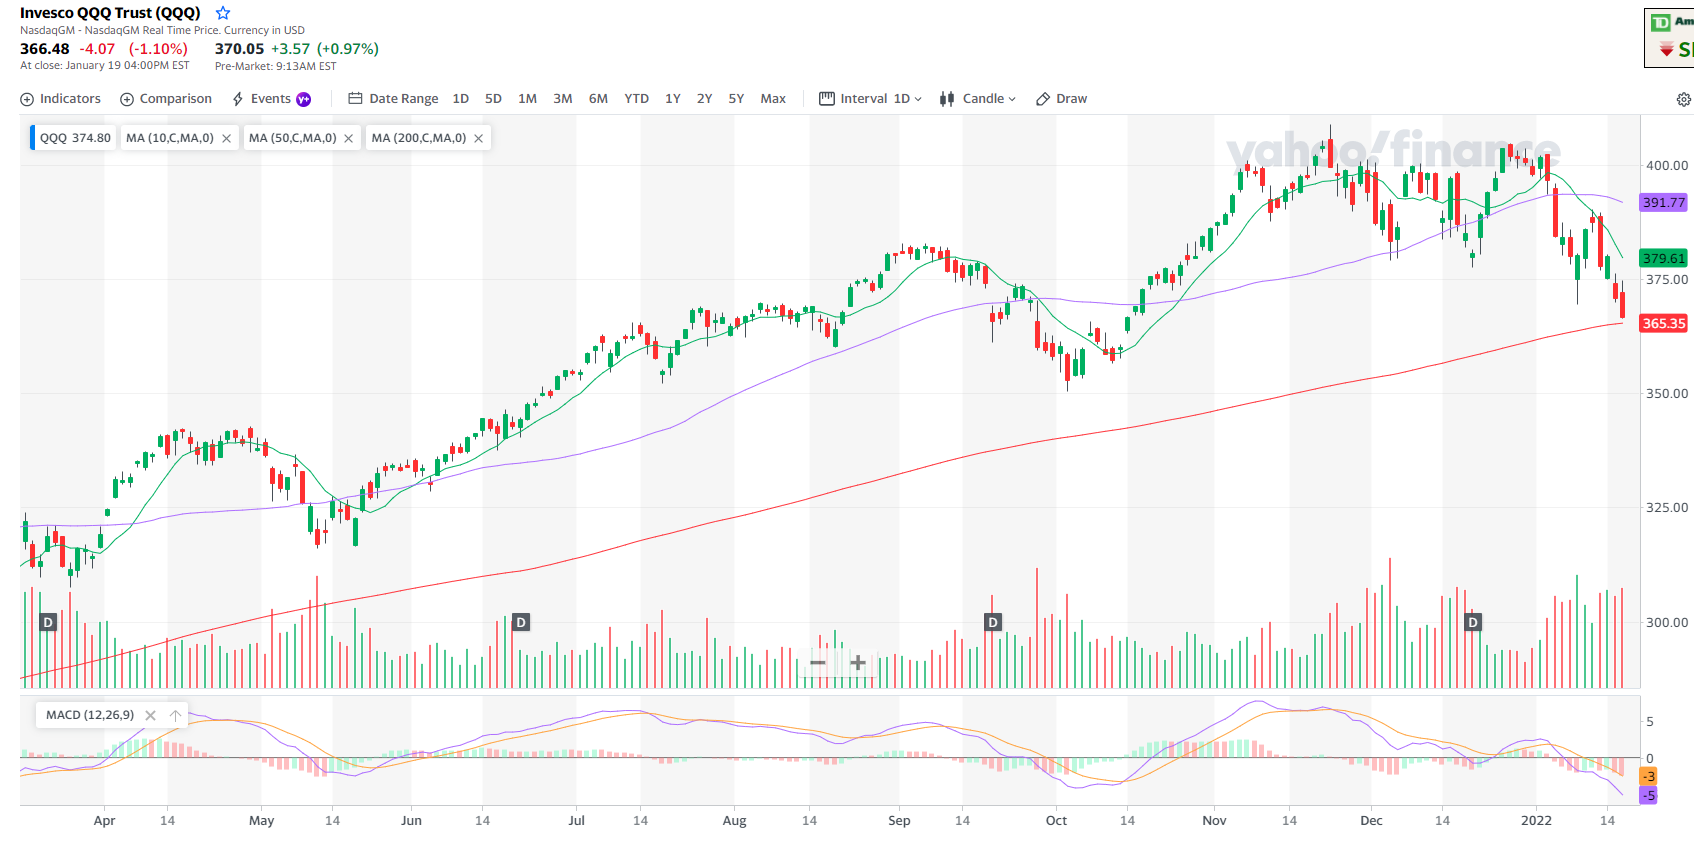
We watched markets fight hard early on yesterday and climb up from a gap up open only to lose steam and add to the decline. The QQQ (the ETF that tracks the NASDAQ) tracks the NASDAQ) is sitting right on its 200 day moving average.

These widely followed indicators are almost like a self-fulfilling prophecy. Big institutions use elaborate algorithms to trade huge amounts of money and they often include these key indicators, like the 200 day moving average. This is not to say it is the only element of the formula, but it very often included. As a price drops below that point, these systems will often start selling the drop, buy options that leverage the decline, or find anyway they can to play the short side. While the 200 Day Moving average may not be the only factor in the formula, the actions triggered by the price crossing that line may also trigger other factors in the system.
What can happen is the domino effect and the downtrend can quickly pickup momentum. In a perfect world, these same programs will start to spot buying opportunities and that can soften the drop or maybe reverse it.
We saw the VIX climb a bit yesterday but not as much as it had jumped recently. If we see that spike up again, chances are we will see the drop move down quicker. If volatility holds flat or goes down it supports a recovery from these pullbacks and corrections.
If you want some great ways to use these big money formulas to your advantage, check our Chris Verhaegh’s WIN program. It makes using the math simple and reliable.
Keep learning and trade wisely,
John Boyer
Editor
Market Wealth Daily


Recent Comments