
Happy Fabulous Friday!
I teach everyday people (like me) to trade options. I do my best to write in an understandable way as if we are talking over the kitchen table.
The market was down 3 out of 5 days last week. I am typing this on Wednesday, and you won’t get this until Friday. A lot can change in a couple days.
For today’s Trade of the Day, we will be looking at Snap Inc., Symbol (SNAP).
Snap Inc. operates as a camera company in the United States and internationally. The company offers Snapchat, a camera application with functionalities, such as Camera, Communication, Snap Map, Stories, and Spotlight that enable people to communicate through short videos and images. It also provides Spectacles, an eyewear product that connects with Snapchat and captures video from a human perspective; and advertising products, including AR and Snap ads. The company was formerly known as Snapchat, Inc. and changed its name to Snap Inc. in September 2016. Snap Inc. was founded in 2010 and is headquartered in Santa Monica, California.
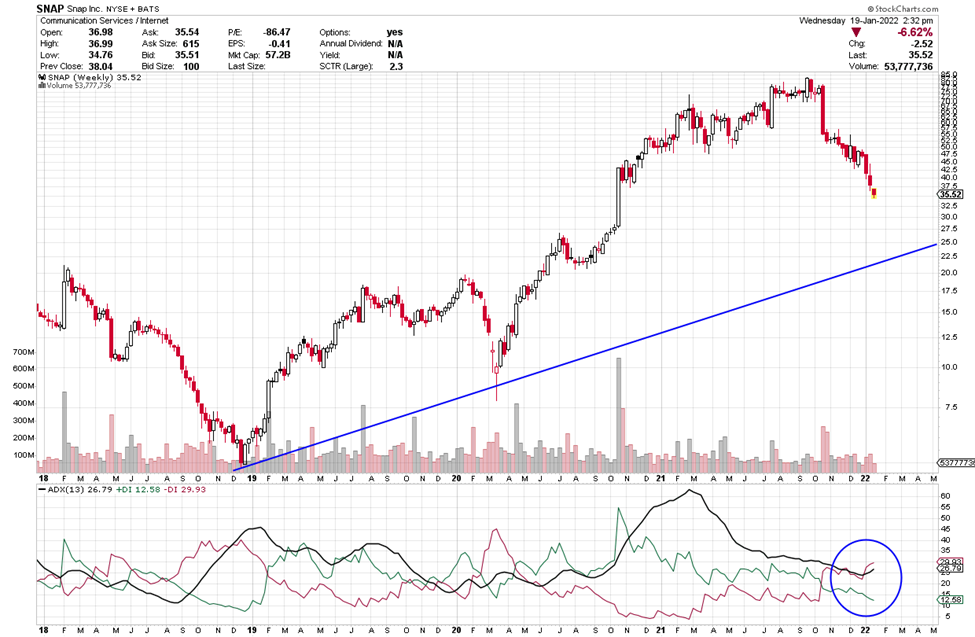
Let’s look at SNAP’s weekly chart.
The ADX -DI (red line) is above the +DI and the black ADX line is heading up. As long as the -DI is above the +DI, price should fall. Red above green is an indication of strength. When the -DI is bullish and the ADX turns up, it shows price is likely to fall. If you want to learn more about ADX, read on or, if not, scroll down to the alert.

Average Direction Index (ADX) – Strength Indicator
The Average Directional Index consists of 3 lines: Green, Red and Black.
Green = +DI (Bullish)
Red = -DI (Bearish)
Black = ADX Strength Line
The DI line that is on top is in control. If the ADX line is heading up, strength is supporting the DI line that is on top and in control.
Each candle on the chart represents price movement over a 5-day (week) period; therefore, it takes weeks for trades to play out. On the chart, the week is a bearish candle as I type. When the +DI crosses over the -DI line, it gives a buy signal for Calls as the +DI line (green) appears as if it is in control and rising to head up on the ADX indicator, and as the ADX turns up that is even more bullish, suggesting an upward move is gaining strength. When the -DI (red line) crosses the green and the black line points up it shows a downward trend and Puts can be considered.
SNAP Potential Trade – Showing Strength
This signal could give a quick payout if it continues its downward move, and the strength of this pattern continues. I am typing this on Wednesday and SNAP costs about $35. If SNAP’s price moves below $35 and the – DI (red line) is above the +DI with the black line heading up you could consider a Put trade. The short-term price target for SNAP is $30 and then, perhaps, lower. With the swings in past months, I am suggesting small profit targets until a market trend starts again.
Option trading offers the potential of a lower initial investment and higher percentage gain. Let’s take a look and make a comparison.
It would be silly to buy shares of SNAP if you expect the price to go down. With options, you can profit even when the market goes down.
If you bought 1 Put option covering 100 shares of SNAP with a Feb 18th (Feb22) expiration date for the 30 strike the premium would be approximately $1.26 today or $126 for 1 option. If price fell to $30 over the next few weeks, the premium would likely increase $2.50 giving $250 profit on your $126 investment, this is an 198% gain. A nice profit even with the market going down.
Trading options is a win, win, win opportunity. Options often offer a smaller overall investment, covering more shares of stock and potential for greater profits.
I like to stress when trading options, you don’t need to wait for the expiration date to close the trade. You can close anywhere along the way prior to the expiration date. It is never a bad idea to take profit.
Trading options is like renting stocks for a fixed period of time. The potential to generate steady income with options is real and it can be transforming. Watch this video to learn how you can use option trading to achieve financial freedom. click here
Yours for a prosperous future,
Wendy Kirkland

Past Equity Candidates:
Last Friday we looked at buying ETSY Jan 28th 175 Put strike. The premium would have been around 14.05. As of today (Wednesday) it is about the same price. We will continue to monitor this trade.


Recent Comments