
A couple weeks ago we talked about the potential scenarios to look for this year. (check out the article here) In one of the scenarios we looked back to a recent long bull market and took note of how it ended. The market turned at the beginning of the year and ran down to a recent level of support before it got stuck in a range for months.
As we try to get a sense of where the bottom will be for this drop, we can see a recent low that was tested multiple times in the Dow at about 34,000.
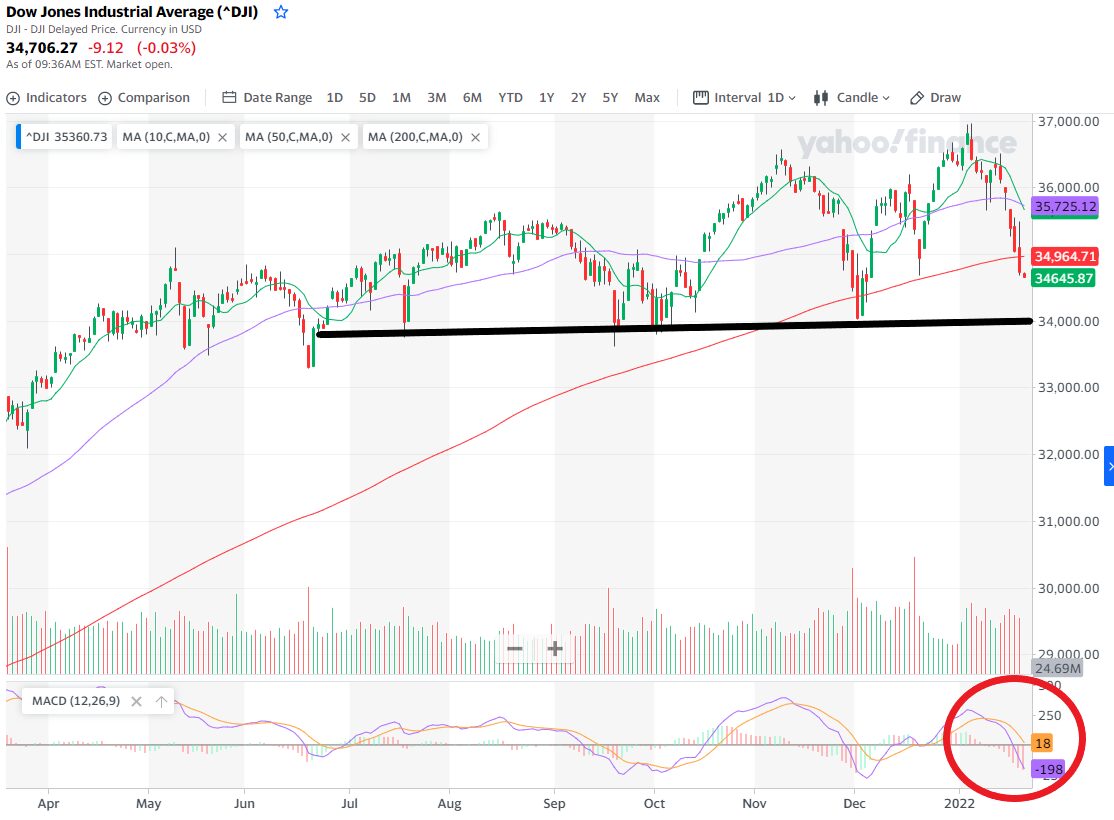

We will be keeping an eye out for potential support at the 34k point. If we see a bit of a rebound it is a sign to exit short positions and take more moderate long positions until we can confirm a new trend.
We are also going to keep an eye on the MACD. IF we see it start to curl up as we find some support it could tell us we have reached the max of the oversold move.
Using inverse Index ETFs is a great way to trade this type of broad drop. Consider UDOW, the inverse of the the DOW–SQQQ the inverse of the NASDAQ–And SPXU, the inverse of the S&P. These examples are also leveraged which means they move at 2-3x the move of the index they are tracking.
If you are looking for other indicators to reveal when momentum is getting exhausted, definitely check out Lee Gettess’ Momentum Trading with Precision.
Keep learning and trade wisely,
John Boyer
Editor
Market Wealth Daily


Recent Comments