
Tuesday, September 28th 2021
Happy Thankful Tuesday!
I am excited to share that you don’t need special education or to sit in front of the computer all day to trade options. It can be easily learned if you are interested in spending an hour or so a week earning money in what could be considered “renting” stocks for a short period of time.
This is why I show you the details about an equity’s symbol and pattern each week.
I am typing this on Sunday, before the new week starts. Last week, the Dow was down 3 days out of 5. Monday dropped like a rock. Tuesday was down as well but not to the same degree and Wednesday through Friday worked to recover, but only recouped about half of the drop. The last quarter of the year as we head into October is traditionally a positive quarter.
For the updates on previously discussed symbols, please scroll down.
For today’s Trade of the Day, we will be looking at salesforce.com,inc., symbol (CRM).
Before analyzing CRM’s chart, let’s take a closer look at the company and its services.
salesforce.com, inc. develops enterprise cloud computing solutions with a focus on customer relationship management worldwide. The company offers Sales Cloud to store data, monitor leads and progress, forecast opportunities, and gain insights through analytics and relationship intelligence, as well as deliver quotes, contracts, and invoices. It also provides Service Cloud, which enables companies to deliver personalized customer service and support, as well as a field service solution that enables companies to connect agents, dispatchers, and mobile employees through a centralized platform, which helps to schedule and dispatch work, and track and manage jobs in real-time.
Additionally, the company offers various solutions for financial services, healthcare and life sciences, manufacturing, consumer goods, government, and philanthropy. The company also provides professional services and education services, including instructor-led and online courses; and support and adoption programs. It provides its services through direct sales; and consulting firms, systems integrators, and other partners.
The company was founded in 1999 and is headquartered in San Francisco, California.
Each candle on the chart represents price movement over a 5-day (week) period. The indicator at the bottom of the chart is a Channel Commodity Index (CCI).
I drew a line below the candles, if price stays above that line, the upward trend should continue. Watch for a continued rise toward its target.
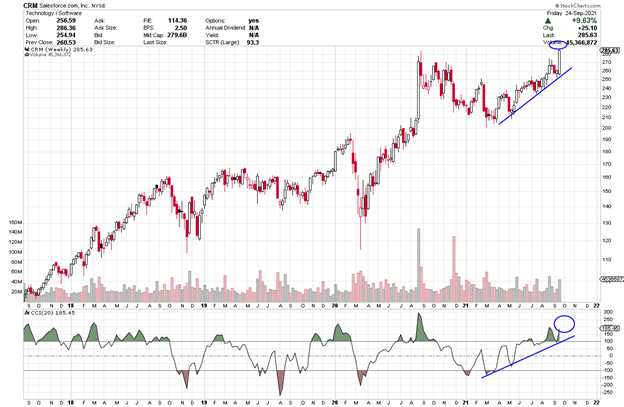

A cross down through the CCI zero or -100 line is bearish, in that it is suggesting price has gone from bearish to even more bearish. A cross up through the zero line and a cross through 100, suggests price is bullish. If you want to learn more about the CCI, you can read through the short section below or you can scroll down to the alert signal.
Channel Commodity Index
A cross up and over the CCI -100 or the zero line can issue an entry signal as it moves from being bearish to bullish. A rise toward 100 is a continuation of that bullishness. Up through the 100 line creates a green fin of bullishness, until it drops back down through the 100-line.
Also, a pullback and then, as it heads back up is another bullish indicator.
A break below the zero line means it has gone from bullish to bearish and a drop below -100 suggests even more bearishness.
The Commodity Channel Index (CCI) is a versatile indicator that can be used to identify a new trend or warn of extreme conditions. Originally, it was developed to identify cyclical turns in commodities, but the indicator can be successfully applied to indices, ETFs, stocks and other securities. In general, CCI measures the current price level relative to an average price level over a given period. CCI is relatively high when prices are far above their average but is relatively low when prices are far below their average. In this manner, CCI can be used to identify overbought and oversold levels or breaks from one level to another.
Check Out How This Rise in Price Could Pay Out Big Time
CRM is bullish as it rises again further above the 100 line. This week’s candle is apt to continue its upward movement that could take it higher. We are looking for a continued rise above the CCI 100 line and up to a price of $300 and then higher. The target is $300.
Potential Profit Play for CRM
CRM’s price continues to move up. I am writing this on Sunday, if price continues to rise above 286 when you receive this on Tuesday, you could consider a call option trade. We are expecting the CCI indicator to continue rising further above the 100 line.
Price is currently at approximately $285 as I write over the weekend and is expected to continue heading up to $286 perhaps, hitting the target of $300 and then higher.
If the CCI line stays above the 100 line and then, continues up, price will continue its current uptrend and continue to rise. We will keep an eye on it over the course of the next few weeks.
The short-term price target for CRM is $300 and, perhaps, higher.
To buy shares of Salesforce (CRM) stock today would cost approximately $286 per share.
I am suggesting that the price of CRM may rise to $300.
Option trading offers the potential of a lower initial investment and higher percentage gain. It is like renting stock versus buying out right. Let’s take a look.
If you bought 2 shares of PLTR at $286, total investment $572 and it increased in price to $300, it would result in a profit of $14 or $28 for 2 shares or an 4.9% gain.
If you bought one Call option contract covering 100 shares of CRM’s stock with a Oct 15th (Oct 21) expiration date for the 300 strike, the premium would be approximately 2.24 per share or a total of $224 for the contract of 100 shares. If price increased the expected $14 over the next few weeks to $300 target, the premium would increase approximately $8.00 to $10.24. This is a gain of $800 on your $224 investment or 357% profit. That would be a terrific trade!
It is exciting to make money if price rises or falls.
I want to remind you that you can sell to close and take profit any time along the line before the expiration date. You don’t have to hold the contract until expiration.
Options often offer a smaller overall investment, covering more shares of stock and potential for greater profits. This is like renting stocks versus having to pay full price to buy.
This said, if you are having any kind of trouble taking advantage of these trades, we don’t want you to miss out. I have put together programs that help traders just like you access the potential profits that options provide. Be sure to check out the programs shared in this email and we will make it easy for you to get your share.
I love to trade, and I love to teach. It is my thing.
Yours for a prosperous future,
Wendy Kirkland
PS-I have created this daily letter to help you see the great potential you can realize by trading options. Being able to recognize these set ups are a key first step in generating wealth with options. Once you are in a trade, there is a huge range of tools that can be used to manage the many possibilities that can present themselves. If you are interested in learning how to apply these tools and increase the potential of each trade, click here to learn more.
Previous Equities discuss:
Three weeks ago, we discussed FSLR and a 105 strike with an Oct 1st (Oct wk1) expiration and a premium of 1.24. It hit 107.50 and its premium rose to 2.95 or a gain of 1.71 or 73% profit. Nice trade! Last week FSLR got caught up in the market pullback.
Last week, we looked at PLTR and a October 8th expiration, 34 strike and premium of .24. Price dropped on Monday and Tuesday, so no trade would have taken place. That said, by the end of the week, PLTR was only down .15 and now is likely to continue up if the market as a whole inches up.


Recent Comments