
Happy Thankful Tuesday!
It’s not too late!! I will be doing a presentation today at Metastock’s Online Traders Conference. It’s free and you can be a part of it from home. Click here for more info.
I am excited to share that you don’t need special education or to sit in front of the computer all day to trade options. It can be easily learned if you are interested in spending an hour or so a week earning money in what could be considered “renting” stocks for a short period of time.
This is why I show you the details about an equity’s symbol and pattern each week.
I am typing this on Sunday, before the new week starts. Last week, the Dow was down 4 days out of 5. After being at all-time highs and then talk of inflation, the market pulled back. That said, many equities reported earnings this week and some reported negative results and expectations which took some companies down further than just the overall market pullback.
For the updates on previously discussed symbols, please scroll down.
For today’s Trade of the Day, we will be looking at Shopify Inc., symbol (SHOP).
Before analyzing Shopify’s’s chart, let’s take a closer look at the company and its services.
Shopify Inc., a commerce company, provides a commerce platform and services in Canada, the United States, the United Kingdom, Australia, Latin America, and internationally. The company’s platform provides merchants to run their business in various sales channels, including web and mobile storefronts, physical retail locations, pop-up shops, social media storefronts, native mobile apps, buy buttons, and marketplaces; and enables to manage products and inventory, process orders and payments, fulfill and ship orders, new buyers and build customer relationships, source products, leverage analytics and reporting, and access financing. It also sells custom themes and apps, and registration of domain names.
The company was formerly known as Jaded Pixel Technologies Inc. and changed its name to Shopify Inc. in November 2011. Shopify Inc. was incorporated in 2004 and is headquartered in Ottawa, Canada.
Each candle on the chart represents price movement over a 5-day (week) period. The indicator at the bottom of the chart is a Channel Commodity Index (CCI).
I drew a line below the candles, if price stays above that line, the upward trend should continue. Watch for a continued rise toward its target.
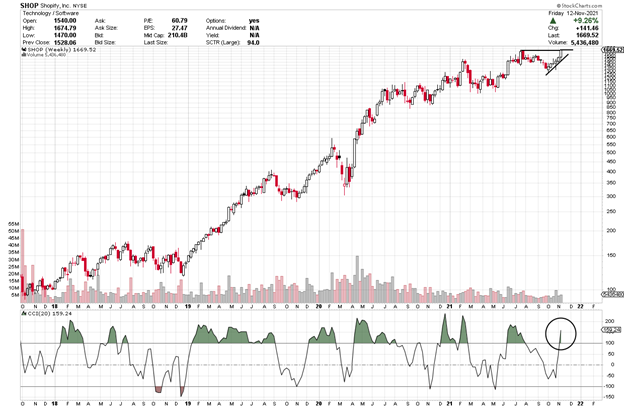

A cross down through the CCI zero or -100 line is bearish, in that it is suggesting price has gone from bearish to even more bearish. A cross up through the zero line and a cross through 100, suggests price is bullish. If you want to learn more about the CCI, you can read through the short section below or you can scroll down to the alert signal.
Channel Commodity Index
A cross up and over the CCI -100 or the zero line can issue an entry signal as it moves from being bearish to bullish. A rise toward 100 is a continuation of that bullishness. Up through the 100 line creates a green fin of bullishness, until it drops back down through the 100-line.
Also, a pullback and then, as it heads back up is another bullish indicator.
A break below the zero line means it has gone from bullish to bearish and a drop below -100 suggests even more bearishness.
The Commodity Channel Index (CCI) is a versatile indicator that can be used to identify a new trend or warn of extreme conditions. Originally, it was developed to identify cyclical turns in commodities, but the indicator can be successfully applied to indices, ETFs, stocks and other securities. In general, CCI measures the current price level relative to an average price level over a given period. CCI is relatively high when prices are far above their average but is relatively low when prices are far below their average. In this manner, CCI can be used to identify overbought and oversold levels or breaks from one level to another.
Check Out How This Rise in Price Could Pay Out Big Time
SHOP is bullish as it rises further above the 100 line. This week’s candle is apt to continue its upward movement that could take it higher. We are looking for a continued rise above the 100 line and price to stay above 1,670 before considering entry and then higher. The target is $1,700.
If you find that you like the CCI Indicator as an easy-to-read indicator, it is included in the 5-Star Academy educational program which includes a chatroom where I am during the day to do live teaching sessions on M-W-F and to answer questions during the day. It is an incredibly supportive community.
Potential Profit Play for SHOP
SHOP is a pricey equity and won’t be a good candidate for everyone’s account. This said, it will be a great example of how option trading works. If SHOP’s price continues to move up, you could consider a Call trade. I am writing this on Sunday, if price continues to rise above 1,670 when you receive this on Tuesday, you could consider a call option trade. We are expecting the CCI indicator to continue rising further above the 100 line.
Price is currently at approximately $1,670 as I write over the weekend and is expected to continue heading up to perhaps, hit the target of $1,700 and then higher.
If price doesn’t stay above $1,670, don’t consider a trade.
If the CCI line stays above the 100 line and then, continues up, price will continue its current uptrend and continue to rise. We will keep an eye on it over the course of the next few weeks.
The short-term price target for SHOP is $1,700 and, perhaps, higher.
To buy shares of Shopify (SHOP) stock today, it would cost approximately $1,670 per share.
I am suggesting that SHOP’s price may rise to $1,700.
Option trading offers the potential of a lower initial investment and higher percentage gain. It is like renting stock versus buying out right. Let’s take a look.
If you bought 4 shares of SHOP at $1,670, total investment $6,680 and it increased in price to $30, it would result in a profit of $120 for the 4 shares or an 1.8% gain.
If you bought one Call option contract covering 100 shares of SHOP’s stock with a Dec 3rd (Dec wk 1) expiration date for the 1,700 strike, the premium would be approximately $64 per share or a total of $6,400 for the contract of 100 shares. If price increased the expected $7 over the next few weeks to $50 target, the premium would increase approximately $20 to $84. This is a gain of $2,000 on your $6,400 investment or 31% profit. That would be a nice trade!
It is exciting to make money if price rises or falls.
I want to remind you that you can sell to close and take profit any time along the line before the expiration date. You don’t have to hold the contract until expiration.
Options often offer a smaller overall investment, covering more shares of stock and potential for greater profits. This is like renting stocks versus having to pay full price to buy.
This said, if you are having any kind of trouble taking advantage of these trades, we don’t want you to miss out. I have put together programs that help traders just like you access the potential profits that options provide. Be sure to check out the programs (like 5-Star Academy mentioned earlier) shared in this email and we will make it easy for you to get your share.
I love to trade, and I love to teach. It is my thing.
Yours for a prosperous future,
Wendy Kirkland
PS-I have created this daily letter to help you see the great potential you can realize by trading options. Being able to recognize these set ups are a key first step in generating wealth with options. Once you are in a trade, there is a huge range of tools that can be used to manage the many possibilities that can present themselves. If you are interested in learning how to apply these tools and increase the potential of each trade, click here to learn more.

Previous Equities discuss:
Six weeks ago, we looked at PRU and a Nov 19th expiration for a 115 strike and a premium of 1.60. Last week it went as high as 2.75 At its high, that is a 72% profit. Since then, it has pulled back.
Four weeks ago, we decided to check out TSLA again with the Nov 19th expiration, 840 strike and a premium of 39.30. TSLA’s price rose the last three weeks, and its premium is now $384. That is a gain of $344.70 per share or $34,470 for the contract. That is a 877% gain. Amazing trade. This is a great example of the leverage of option trading.
Three weeks ago, we discussed ETSY with a Nov. 19th expiration, a 250 strike and a premium of 11.25. It rose to 25.10 and is currently at 22.50. At its high, that is a 123% gain in a few days.
Two weeks, we zero’d in on X and an expiration of Nov 19th, a strike of 30 and a premium of .40. On Tuesday it rose a few cents to 26.86, and then pulled back.


Great excitement to know this