
Happy Fabulous Friday!
I teach everyday people (like me) to trade options. I do my best to write in an understandable way as if we are talking over the kitchen table.
The market was up 3 out of 5 days last week. I am typing this on Wednesday, and you won’t get this until Friday. A lot can change in a couple days. S&P was up Monday and Tuesday but lost all of the gains on today (Wednesday).
For today’s Trade of the Day, we will be looking at Intel Corporation, Symbol (INTC).
Intel Corporation designs, manufactures, and sells essential technologies for the cloud, smart, and connected devices for retail, industrial, and consumer uses worldwide. The company was founded in 1968 and is headquartered in Santa Clara, California.
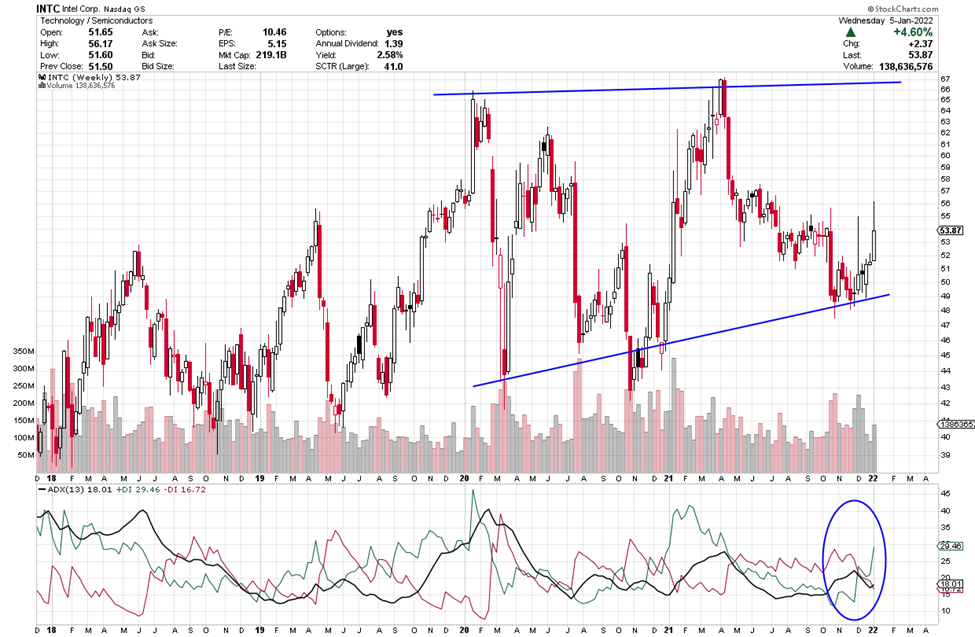
Let’s look at INTC’s weekly chart.
The ADX +DI (green line) is above the -DI and the black ADX line is heading up. As long as the +DI is above the -DI, price should rise. Green above red is an indication of strength. When the +DI is bullish and the ADX turns up, it shows strength. If you want to learn more about ADX, read on or, if not, scroll down to the alert.
Average Direction Index (ADX) – Strength Indicator
The Average Directional Index consists of 3 lines: Green, Red and Black.
Green = +DI (Bullish)
Red = -DI (Bearish)
Black = ADX Strength Line
The DI line that is on top is in control. If the ADX line is heading up, strength is supporting the DI line that is on top and in control.
Each candle on the chart represents price movement over a 5-day (week) period; therefore, it takes weeks for trades to play out. On the chart, the week is a bullish candle as I type. When the +DI crosses over the -DI line, it gives a buy signal (as the +DI line (green) appears as if it is in control and rising to head up on the ADX indicator, and as the ADX turns up that is even more bullish, suggesting an upward move is gaining strength. I’d like to see the green line to continue its upward bias and then the black line to turn straight up and head up as well. All are bullish signs of strength. When the +DI crosses the ADX (black line) and when it rises, it shows a new burst of strength coming into the equity.
INTC Potential Trade – Showing Strength
This signal could give a quick payout if it continues its upward move, and the strength of this pattern continues. I am typing this on Wednesday and INTC started the day at $51+ and is heading up. If INTC’s price moves above or stays above $54 and the plus DI (green line) is above the -DI with the black line heading up you could consider a trade. The short-term price target for INTC is $57 and then, perhaps, higher. With the swings in past months, I am suggesting small profit targets until a market trend starts again.
Option trading offers the potential of a lower initial investment and higher percentage gain. Let’s take a look and make a comparison.
To buy shares of INTC would cost approximately $54 per share and if it reaches its near-term target of $57 that would be a gain of $3 or a .05% gain.
If you bought 10 options covering 100 shares of INTC with a Jan 21st (Jan22) expiration date for the $57 strike the premium would be approximately $.27 today or $270 for 10 options. If price increased to the expected $57 target or a gain of $3 over the next few weeks, the premium would likely increase $1.50 giving $150 profit on your $270 investment, this is an 55% gain. Nice! Awesome trade if it hits it target!
Trading options is a win, win, win opportunity. Options often offer a smaller overall investment, covering more shares of stock and potential for greater profits.
I like to stress when trading options, you don’t need to wait for the expiration date to close the trade. You can close anywhere along the way prior to the expiration date. It is never a bad idea to take profit.
Trading options is like renting stocks for a fixed period of time. The potential to generate steady income with options is real and it can be transforming. Watch this video to learn how you can use option trading to achieve financial freedom. click here
Yours for a prosperous future,
Wendy Kirkland

Past Equity Candidates:
We looked at JNJ Jan 14th 175 strike last week. JNJ did not reach the 175 entry price. No trade.


Recent Comments