
Dear Reader,
Yesterday, we looked at a Daily Price Chart of ServiceNow, Inc., noting the stock’s 50-Day EMA is trading below the 100-Day EMA signaling a ‘Sell’.
For today’s Trade of the Day we will be looking at an On Balance Volume chart for Hartford Financial Services Group, Inc. stock symbol: HIG.
Before breaking down HIG’s OBV chart let’s first review which products and services are offered by the company.
The Hartford Financial Services Group, Inc. provides insurance and financial services to individual and business customers in the United States, the United Kingdom, and internationally. Its Commercial Lines segment offers workers’ compensation, property, automobile, liability, umbrella, bond, marine, livestock, and reinsurance; and customized insurance products and risk management services, including professional liability, bond, surety, and specialty casualty coverages through regional offices, branches, sales and policyholder service centers, independent retail agents and brokers, wholesale agents, and reinsurance brokers.
Confirming a Price Uptrend with OBV
The HIG daily price chart below shows that HIG is in a price uptrend as the current price is above the price HIG traded at five months ago (circled). The On Balance Volume chart is below the daily chart.
On Balance Volume measures volume flow with a single Easy-to-Read Line. Volume flow precedes price movement and helps sustain the price downtrend. When a stock closes up, volume is added to the line. When a stock closes down, volume is subtracted from the line. A cumulative total of these additions and subtractions form the OBV line.
On Balance Volume Indicator
● When Close is Up, Volume is Added
● When Close is Down, Volume is Subtracted
● A Cumulative Total of Additions and Subtractions form the OBV Line
Volume flow precedes price and is the key to measuring the validity and sustainability of a price trend.
We can see from the OBV chart below that the On Balance Volume line for HIG is sloping up. An up-sloping line indicates that the volume is heavier on up days and buying pressure is exceeding selling pressure. Buying pressure must continue to exceed selling pressure in order to sustain a price uptrend. So, On Balance Volume is a simple indicator to use that confirms the price uptrend and its sustainability.
The numerical value of the On Balance Volume line is not important. We simply want to see an up-sloping line to confirm a price uptrend.

Confirmed ‘Buy’ Signal for HIG
Since HIG’s OBV line is sloping up, the most likely future price movement for HIG is up, making HIG a good candidate for a stock purchase or a call option purchase.
Let’s use the Hughes Optioneering calculator to look at the potential returns for a HIG call option spread.
The Call Option Calculator will calculate the profit/loss potential for a call option trade based on the price change of the underlying stock/ETF at option expiration in this example from a flat HIG price to a 12.5% increase.
The Optioneering Team uses the 1% Rule to select an option strike price with a higher percentage of winning trades. In the following HIG option example, we used the 1% Rule to select the HIG option strike price but out of fairness to our paid option service subscribers we don’t list the strike price used in the profit/loss calculation.

Trade with Higher Accuracy
When you use the 1% Rule to select a HIG in-the-money option strike price, HIG stock only has to increase 1% for the option to breakeven and start profiting! Remember, if you purchase an at-the-money or out-of-the-money call option and the underlying stock closes flat at option expiration it will result in a 100% loss for your option trade! In this example, if HIG stock is flat at 76.82 at option expiration, it will only result in a 2.6% loss for the HIG option compared to a 100% loss for an at-the-money or out-of-the-money call option.
Using the 1% Rule to select an option strike price can result in a higher percentage of winning trades compared to at-the-money or out-of-the-money call options. This higher accuracy can give you the discipline needed to become a successful option trader and can help avoid 100% losses when trading options.
The goal of this example is to demonstrate the powerful profit potential available from trading options compared to stocks.
The prices and returns represented below were calculated based on the current stock and option pricing for HIG on 1/4/2023 before commissions.
When you purchase a call option, there is no limit on the profit potential of the call if the underlying stock continues to move up in price.
For this specific call option, the calculator analysis below reveals if HIG stock increases 5.0% at option expiration to 80.66 (circled), the call option would make 52.3% before commission.
If HIG stock increases 10.0% at option expiration to 84.50 (circled), the call option would make 107.2% before commission and outperform the stock return nearly 11 to 1*.
The leverage provided by call options allows you to maximize potential returns on bullish stocks.
The Hughes Optioneering Team is here to help you identify profit opportunities just like this one.

Interested in accessing the Optioneering Calculators? Join one of Chuck’s Trading Services for unlimited access! The Optioneering Team has option calculators for six different option strategies that allow you to calculate the profit potential for an option trade before you take the trade.
Average Portfolio Return of 145.4%
Below is a screenshot of the current open trade profit opportunities from Chuck’s Weekly Option Alert Trading Service. There are currently $153,972.62 in open trade profit opportunities with an average portfolio return of 145.4% demonstrating the ability of the Optioneering Strategy to deliver substantial returns with no losing portfolios**.
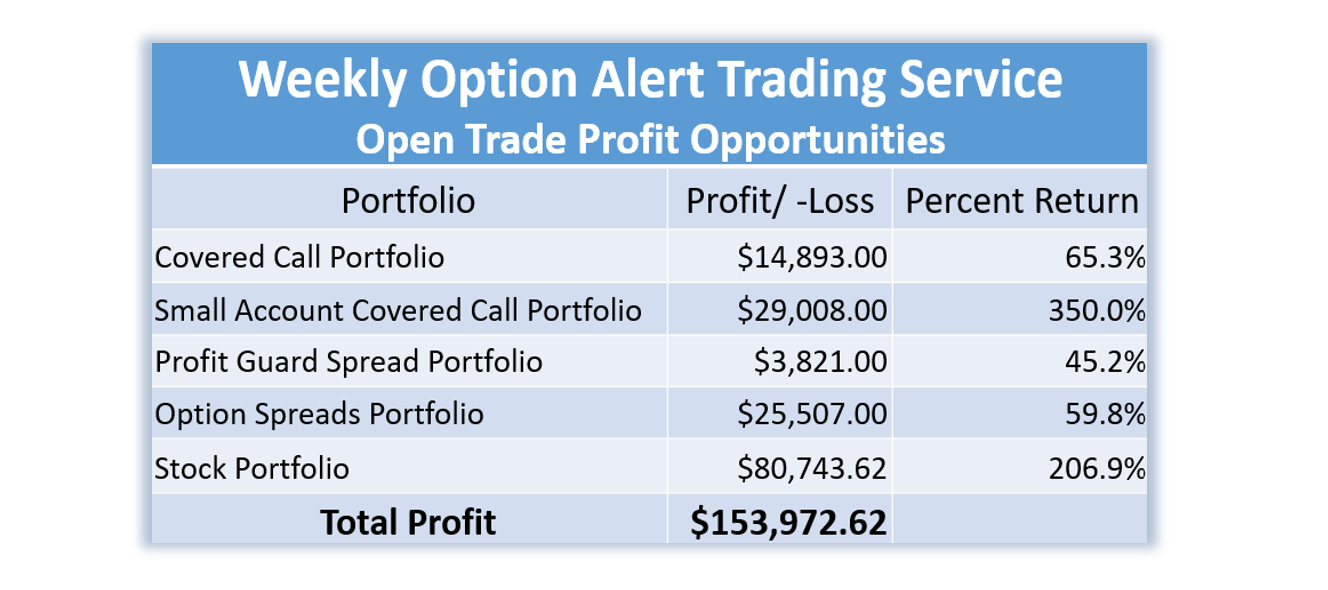
**Open trade profit results represent the open trade profit performance for the portfolio displayed on 1/4/23. Open trade profits may have increased or decreased when trades were closed out. Trading incurs risk and some people lose money trading. Past performance does not necessarily predict future results. Member profits and losses are not tracked. Profit potential is taken from results of signaled trades, not actual member results. Not all members make the trades.
Chuck’s $3,000 Trading Scholarship
I don’t want you to miss a single opportunity to potentially reach your goals. That’s why I’d like to offer you a scholarship of the full $3,000 Enrollment Fee of my exclusive Inner Circle Trading Service***.
I want you to follow in my footsteps and succeed beyond your wildest dreams, so please call Brad in my office at 1-866-661-5664 or 1-310-647-5664 and get started today!
You can also CLICK HERE to schedule a call now!
Wishing You the Best in Investing Success,

Chuck Hughes
Editor, Trade of the Day
Have any questions? Email us at dailytrade@chuckstod.com
*Trading incurs risk and some people lose money trading.
** Inner Circle Trading Service program provides training package and specific trade signals for one year. The first 10 people to sign up each day this offer is valid, will get a waiver of the standard fee, which is the price charged to anyone signing up after the first 10 people per day.


Recent Comments