
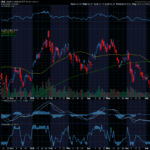
If you took a quick glance at the chart below, you may think it is a recent chart but it is an example of how patterns in the market can often repeat. This chart is of the 1999 dot com boom and bust. But it holds some lessons for us as we map out what to expect this year.


Is this exactly what the market will do? Not at all. But it does show what the market is capable of. In 1999 retail traders felt like they could do no wrong. Then they spent 2000 licking their wounds as the winds changed and things just didn’t come as easy anymore. 2001 saw things start to really get ugly and 9/11 was horrifying. But notice that even as thinks started to recover from that crash, there was more blood letting in 2002 before we finally saw a recovery from a bottom that took 6 months to develop.
What we are looking at in the market now can get worse. It may recover but it is capable of delivering more pain. Along the way, however, it will offer up some incredibly lucrative trades, but it does not favor a buy and hold strategy. The key will be to grab profits when you have them. Even if you don’t get out at the tippy top, getting out with a gain is the goal. Take the 10%, 15% win and have no regrets if that move goes to 305 or 40% before reversing. This is a time to be a turtle.
Keep learning and trade wisely,
John Boyer
Editor
Market Wealth Daily


Recent Comments