
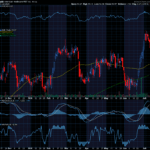
The S&P broke through the 50 day moving average last week as it pushed upward. We will be watching closely to see if it continues above the 4100-4150 level. That would be a sign that it is breaking out of the chaotic downtrend we have seen since the beginning of the year.
After the bear market rally we watched from July through the middle of August it is easier to see that these bounces as the market drops can be misleading.

The chart above shows the break above the 50, but if we back up a bit you can see the down trend is still intact. Take a look at the chart below.


Determining the true momentum of a trend can be a critical factor in placing your next trade. When the broader market (which the S&P is a great benchmark of) is in a strong trend, the likelihood of you next trade moving in that same direction is greater. Trading is all about increasing the likelihood of wins with as many factors as possible.
Joe Duffy’s understanding of momentum has helped many traders exploit the way it can find trades with increased likelihood of winning. He is going to be walking through how he uses that in up and down markets to produce consistent winners in a webinar this Wednesday. Be sure to sign up now and make sure you don’t miss what he is going to explain. Click here to sign up.
Keep learning and trade wisely,
John Boyer
Editor
Market Wealth Daily


Recent Comments