It has been just over a month since it happened.
It may have been subtle to many or even most at the time, but now, a month later, what happened a month ago is risking a reversal. Once again, this move is starting off by looking a bit subtle, but when we dive into the charts, we can see it, we can understand it, and we can figure out what pattern looks possible if not probable.
What am I talking about? I don’t want to ruin the punchline, so I’ll simply walk through the whole process, and then let you see what I’m looking at that would traditionally be a part of my Outlier Watch List as a result, and it likely will be whether this move gets started or not before the end of this week.
The first chart that we all love to hate because it’s such a volatile sector (and don’t worry, the final idea will be a much less volatile one) – Bitcoin:

As you can see, On February 26th, bitcoin started its main breakout. As people looked at crypto currencies, a natural tendency was, of course, to look at another US Dollar alternative – Gold:


And there it went. Gold started to play catchup a couple of days later on March 1st. However, the real story to me wasn’t gold here. It was the price of bitcoin RELATIVE to the price of gold, seen here:

As you can see, the price of bitcoin divided by the price of gold started to spike on February 26th and quickly stabilized in the recent range between 28.5 and 34.0 once gold started to rally, too. But that range is at risk here. After that pricing ratio fell through some key moving averages, it is testing the lows of the range once again.
So, what does this all mean and how can I leverage it with a trade? One of two scenarios has to happen, with the first option being that the range will continue to hold, in which case either bitcoin will rise, or gold will fall. This would then allow bitcoin’s price relative to gold to hold. Alternatively, the range fails, and that would most likely come with a fall in bitcoin. But, in that case, it would naturally lead to a fall in gold if gold were truly dragged up by bitcoin rather than fundamentally bullish on its own.
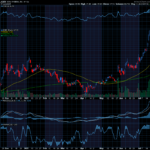
I have reason to believe that gold is NOT bullish on its own that I can’t explain here due to lack of space in an e-mail, and so I will wrap this up with a trade idea. I’ll be looking at gold miners, here represented by the sector ETF GDX:

On March 1st, GDX was testing lows of its range and setting up a potential break down to new lows. Now, it’s at recent highs, and has a lot of downside if my trade thesis is correct given that GDX has ~20% of downside to return to its price from March 1st. And with a large number of highly liquid stocks in the gold miners sector, I can look for an idea with a highly leveraged options trade to turn a seemingly large potential move into an even larger potential profit. And it’s all because both scenarios that I can see as most likely involve a bearish gold environment.
Remember, if you see a leading indicator, the best trade is often in the lagging sector if you can identify it quickly.
So, as always, please go to http://optionhotline.com to review how I traditionally apply technical signals, volatility analysis, and probability analysis to my options trades. And if you have any questions, never hesitate to reach out.
Keith Harwood
Keith@optionhotline.com


Recent Comments