If something happens once, its random. If it happens twice, it could just be coincidence. If it happens five times with a very consistent result, that is the definition of high probability.
We have watched the markets trend up with occasional corrections. In spite of a few pullbacks, we have seen some frequent record highs. The S&P has been no exception. What is worth looking at is what happens in each of these pullbacks.
Look at this chart and check out how predictable the S&P has reacted:
(Chart below)
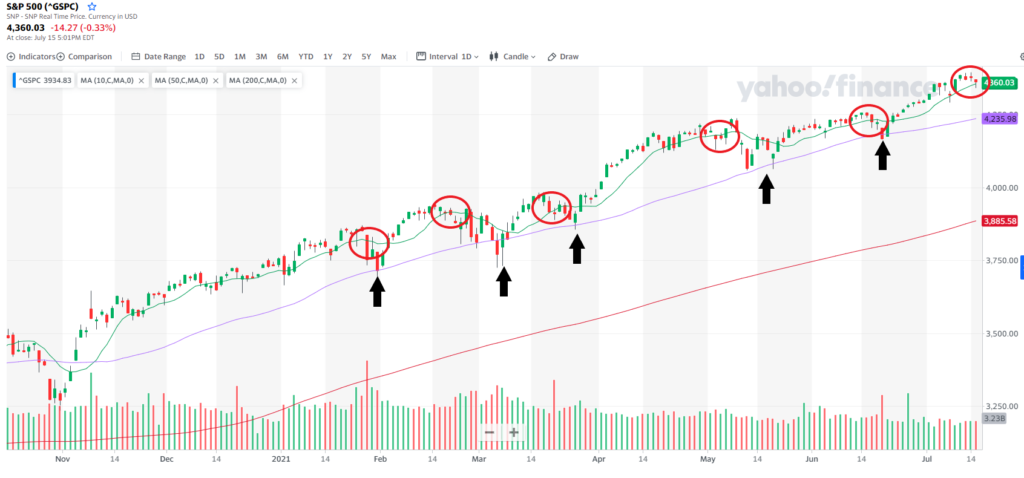
Since the beginning of the year we have seen the S&P pull back through the 10 day moving average and drop. Each time it does, it finds support at the 50 day and then continues the rally.
On the chart above it shoes each pull back circled in red and the bounce off the 50 day moving average with the arrows.
Now, we see a similar move setting up and offering a great, high probability trade to take.
(more below)

Not only is there a great likelihood that if the trend breaks the 10 day it will continue down farther, but we can also expect it to continue to the 50 day and then reverse.
Don Fishback has a great guide that helps recognize opportunities like this and find the option strategy with the highest statistical probability of being profitable. Be sure to grab his free guide here that walks you through every step of his successful process.
Keep learning and trade wisely,
John Boyer
Editor
Market Wealth Daily







Recent Comments