We just had a discussion with Keith Harwood the other day about what to watch to spot a reversal in the markets. One of the key indicators he pointed to was the VIX, a measurement of expected volatility. We noticed that it had hit a wall where it was and hadn’t been able to get any lower. Just this morning, it gapped up in one of it’s biggest moves to flash the alert that wilder moves in the market are on the horizon.
When you look back at chart of the VIX, there is a pretty consistent correlation with its moves up and drops in the market. Basically, when it goes up, the market goes down. Scroll down for the chart:

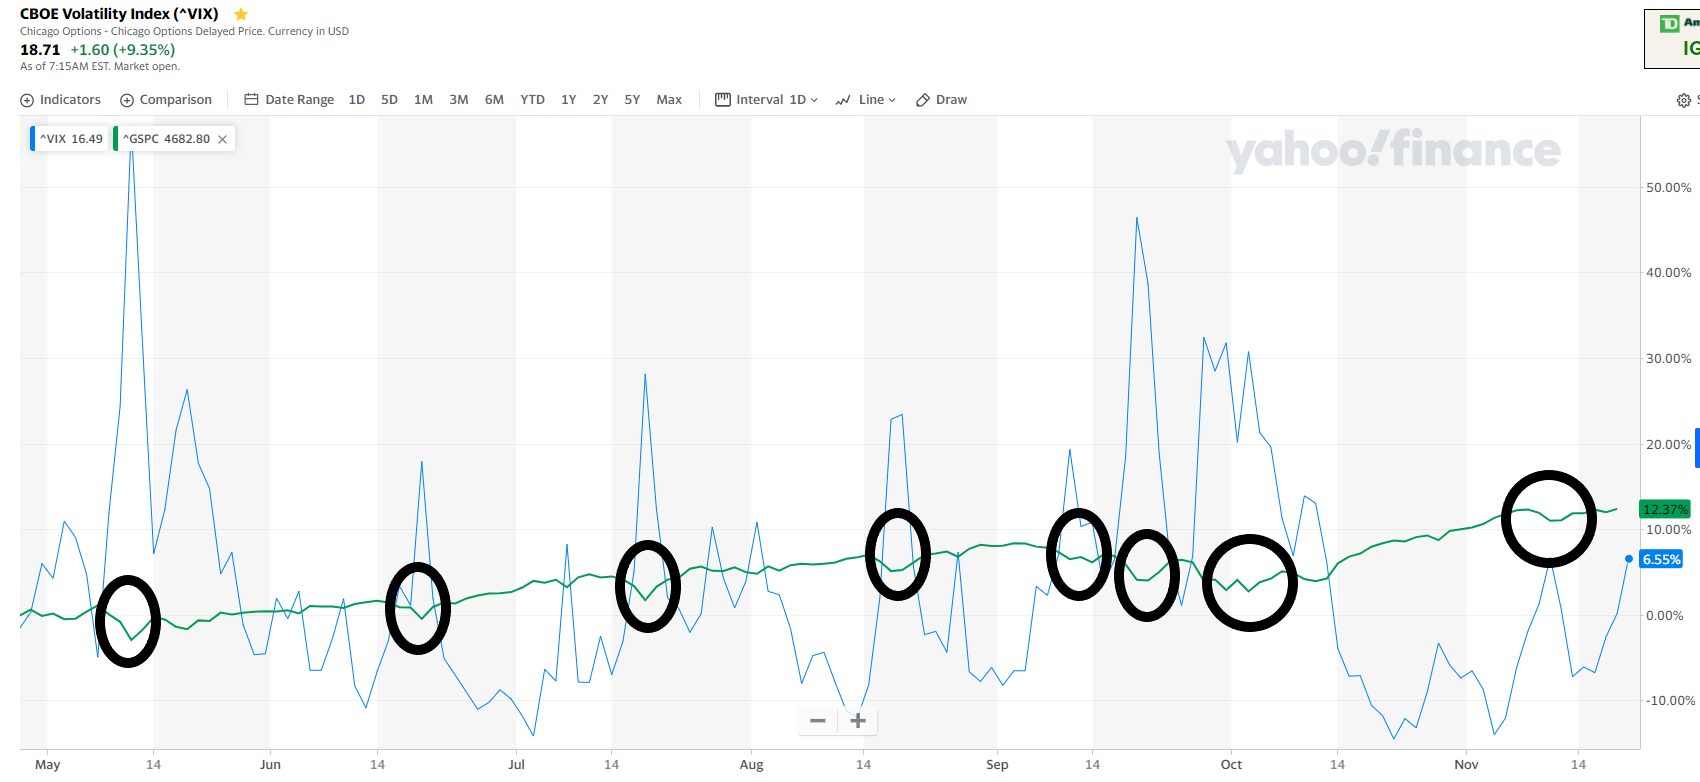
The blue jagged line on the chart above is the VIX and the green line is the S&P. We have seen these pullbacks consistently along the market rally and they create some great opportunities to use options to exploit these moves.
While we keep a close eye on this move setting up take a quick minute to grab Don Fishback’s super simple guide to finding the best options strategy for the current conditions. Armed with the characteristics of each strategy, he makes it easy to choose the best way to take advantage of this move and create a trade with the highest probability of success.
Keep learning and trade wisely,
John Boyer
Editor
Market Wealth Daily


Recent Comments