
This week was a wild one. AMC launching to undefendable prices, jobs data getting overshadowed by global tensions and inflation worries.
When you have a lot of big stuff going on it is easy to miss the one big thing that is working well. This week it was oil.
It staged a rally and hasn’t looked back yet. This begs the question of how high can it go? There is some insight in the charts. (Scroll down for the chart)
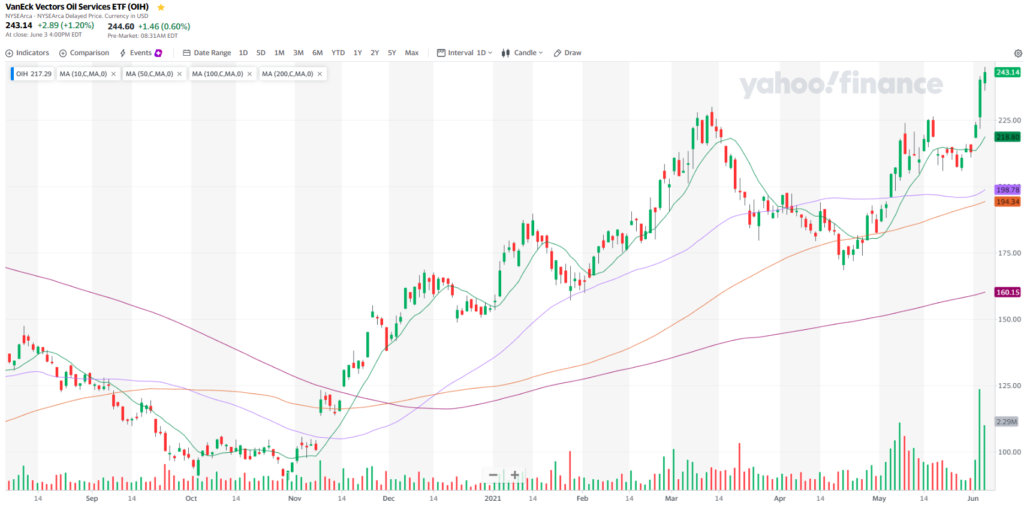
Looking at OIH, the oil ETF, we can see it hit a recent high from March and moved up past it. While it may seem like an indication that it has run it’s course and may return back down to look for support, we have to look at the bigger picture.
It is easy to just look at the default settings on the chart service and miss a potential move. Let’s back up a bit.
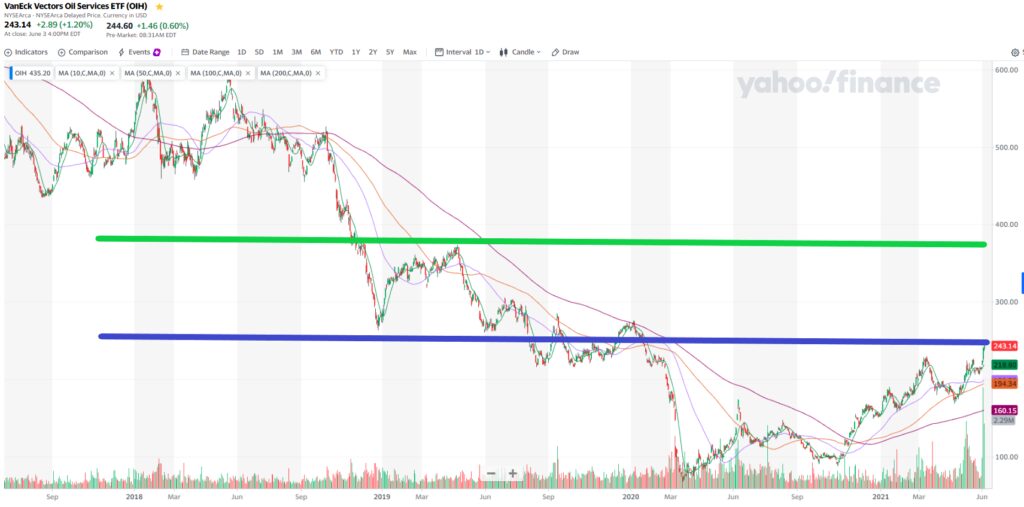
The blue line shows where OIH sat at the beginning of 2020. While it may seem it is peaking, it is really just getting back to where it was. The green line shows where it was at the start of 2019 and highlights that it is no stranger to being double where it sits today.
Confirming the momentum of a trend is actually simple.
Do yourself a favor and grab Joe Duffy’s Little Black Book Of Momentum Setups. It can be the difference between getting out at the wrong time and collecting all you can from a run like this.
Keep learning and trade wisely,
John Boyer
Editor
Market Wealth Daily


Recent Comments