Happy Fabulous Friday!
I teach everyday people (like me) to trade options. I do my best to write in an understandable way as if we are talking over the kitchen table.
Bullish uptrend continues. Last week the market was up 3 days out of 5. This week, it has been up 2 days out of 3. The Dow headed down today son after open. It is a heavy earnings week.
For today’s Trade of the Day, we will be Exxon Mobil Corp. is a Dow listed company.
Exxon Mobil Corporation explores for and produces crude oil and natural gas in the United States and internationally. The company is also involved in the manufacture, trade, transport, and sale of crude oil, natural gas, petroleum products, petrochemicals, and other specialty products; and manufactures and sells petrochemicals, including olefins, polyolefins, aromatics, and various other petrochemicals.
As of December 31, 2020, it had approximately 22,239 net operated wells with proved reserves. The company was founded in 1870 and is based in Irving, Texas.
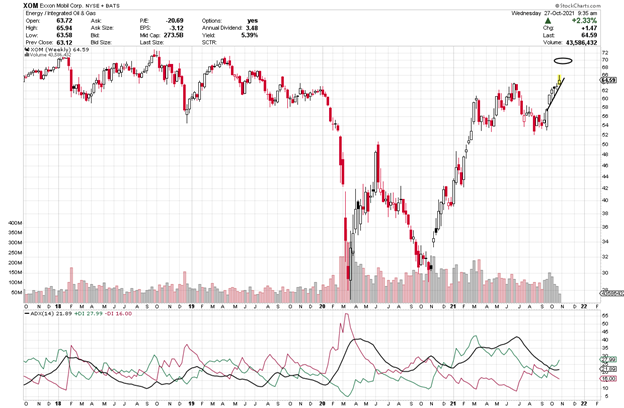
Let’s take a look at XOM’s weekly chart.
The ADX +DI (green line) is above the -DI and if it keeps heading up, the ADX line will turn up again. As long as the +DI is above the -DI, price should rise. Green above red is an indication of strength. When the +DI is bullish and the ADX turns up, it shows strength. If you want to learn more about ADX, read on or, if not, scroll down to the alert.

Average Direction Index (ADX) – Strength Indicator
The Average Directional Index consists of 3 lines: Green, Red and Black.
Green = +DI (Bullish)
Red = -DI (Bearish)
Black = ADX Strength Line
The DI line that is on top is in control. If the ADX line is heading up, strength is supporting the DI line that is on top and in control.
Check Out the Trade Alert Signal
Each candle on the chart represents price movement over a 5-day (week) period; therefore, it takes weeks for trades to play out. On the chart, the week is a bullish candle as I type. When the +DI crosses over the -DI line, it gives a buy signal (as the +DI line (green) appears as if it is in control and rising to head up on the ADX indicator, and as the ADX turns up that is even more bullish, suggesting an upward move is gaining strength. I’d like to see the green line to continue its upward bias and then the black line to turn straight up and head up as well. All are bullish signs of strength. When the +DI crosses the ADX (black line) and when it rises, it shows a new burst of strength coming into the equity.
The Black ADX line is a strength line and as it flips up and continues to head up, it shows strength, and we’ll know strength will continue to flow into this equity. We will keep an eye on XOM over the course of the next few weeks.
If XOM’s price moves above or stays above $65, you could consider a trade. The short-term price target for XOM is $70 and then, perhaps, higher. With the swings in past months, I am suggesting small profit targets until a market trend starts again.
XOM is a modestly priced equity and trading it will likely be appropriate for most trading accounts, either way it is still a great equity to study to learn about the benefits of option trading.
XOM Potential Trade – Showing Strength
This signal could give a quick payout if it continues its upward move, and the strength of this pattern continues. It looks as if it could push above $65. I am typing on Wednesday and XOM started the day at $64+ and is heading up, if it continues above 65 showing it is moving up, a trade could be considered.
To buy shares of XOM would cost approximately $65 per share and if it reaches its near-term target of $70 that would be a gain of $5 or 7.6%.
This is a great example of the benefits of trading options. Let’s discuss this as a study case.
Option trading offers the potential of a lower initial investment and higher percentage gain. Let’s take a look and make a comparison.
The plus DI (green line) is above the -DI and if it stays above the -DI (red) line and rises above $65 by Friday a call trade can be considered.
If you buy 10 shares at $65, you will invest $650. If the stock increases in price to $70, you will earn a profit of $5 per share or $50 for the 10 shares or about 7.6%.
If you bought one option contract covering 100 shares of XOM with an Nov 19th (Nov 21) expiration date for the $70 strike and premium would be approximately $.20 today or $20 per 100 share contract. If price increased to the expected $70 target or a gain of $5 over the next few weeks, the premium would likely increase $2.50 to $2.70 ($5 x 100 share contract = $500 Profit.) $500 profit on your $20 investment, this is an 1250% gain. Nice! Awesome trade if it hits it target!
Trading options is a win, win, win opportunity. Options often offer a smaller overall investment, covering more shares of stock and potential for greater profits.
I like to stress when trading options, you don’t need to wait for the expiration date to close the trade. You can close anywhere along the way prior to the expiration date. It is never a bad idea to take profit.
Trading options is like renting stocks for a fixed period of time. The potential to generate steady income with options is real and it can be transforming. Watch this video to learn how you can use option trading to achieve financial freedom. click here
Yours for a prosperous future,
Wendy Kirkland

Past Equity Candidates:
Two weeks ago, we talked about ULTA and the Nov 5th (Nov wk 1) expiration, 400 strike and a premium of 9.80. On the 18th, it reached 18.35. Not quite 100% gain. Super trade. It has since pulled back as I type on Wednesday.
Last week, we discussed ETSY Nov 5th (Nov wk 1) and a strike of 240 and a premium of 9.30. It went up to $16.50 or a 7.20 gain or 77% in a short time.


Recent Comments