
A month ago, Apple gapped down and couldn’t climb back up. Yesterday, it repeated that move to an even lower level than at the beginning of August. Take a look at these two charts and see if you can tell which is APPL.

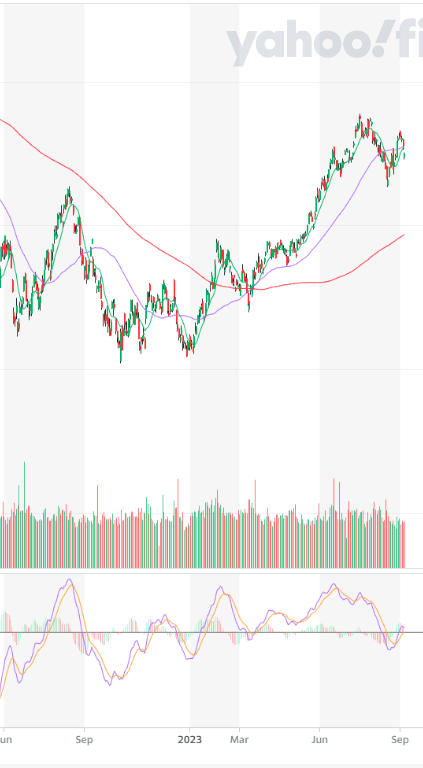

There are a couple giveaways but APPL is the top chart and the bottom chart is the NASDAQ. This is a pretty clear example of how correlated these two are. So when the market sees APPL take a dive, we can expect to see some selling. A way to confirm that we are truly in a selloff is to look at the VIX, the indicator the CBOE created to show expected volatility in the near future.

We can see that it is starting to move up but not near a recent high yet. Keith Harwood talked us through a great indicator that can reveal where the VIX is headed in a quick chat the other day. (check it out here).
Even though when the VIX goes up the market usually goes down it isn’t a great leading indicator. It will, however, confirm that we are in for a more significant slide. If we see the VIX pop in the next couple days, we should start preparing for a broader downturn. The good news is there is still money to be made in a bear market. Check out this article to get a bunch of ideas that can help protect and grow your account if things start to plunge.
Keep learning and trade wisely,
John Boyer
Editor
Market Wealth Daily


Recent Comments