

We have had some massive wins with one pattern (20x on this trade) but it has it’s flaws. This morning’s scan highlighted a great example.
When it works well you can see the bullish crossover give crystal clear signals. Even those need to be confirmed with other indicators and conditions but they offer high probability set ups. But there are definitely tickers that are immune to this trade detector. Fortunately, the charts usually let you know if the stock or etf you are looking at behaves well and lets the crossover telegraph its next move.
Here is the textbook example of a potentially false signal. Take a look:
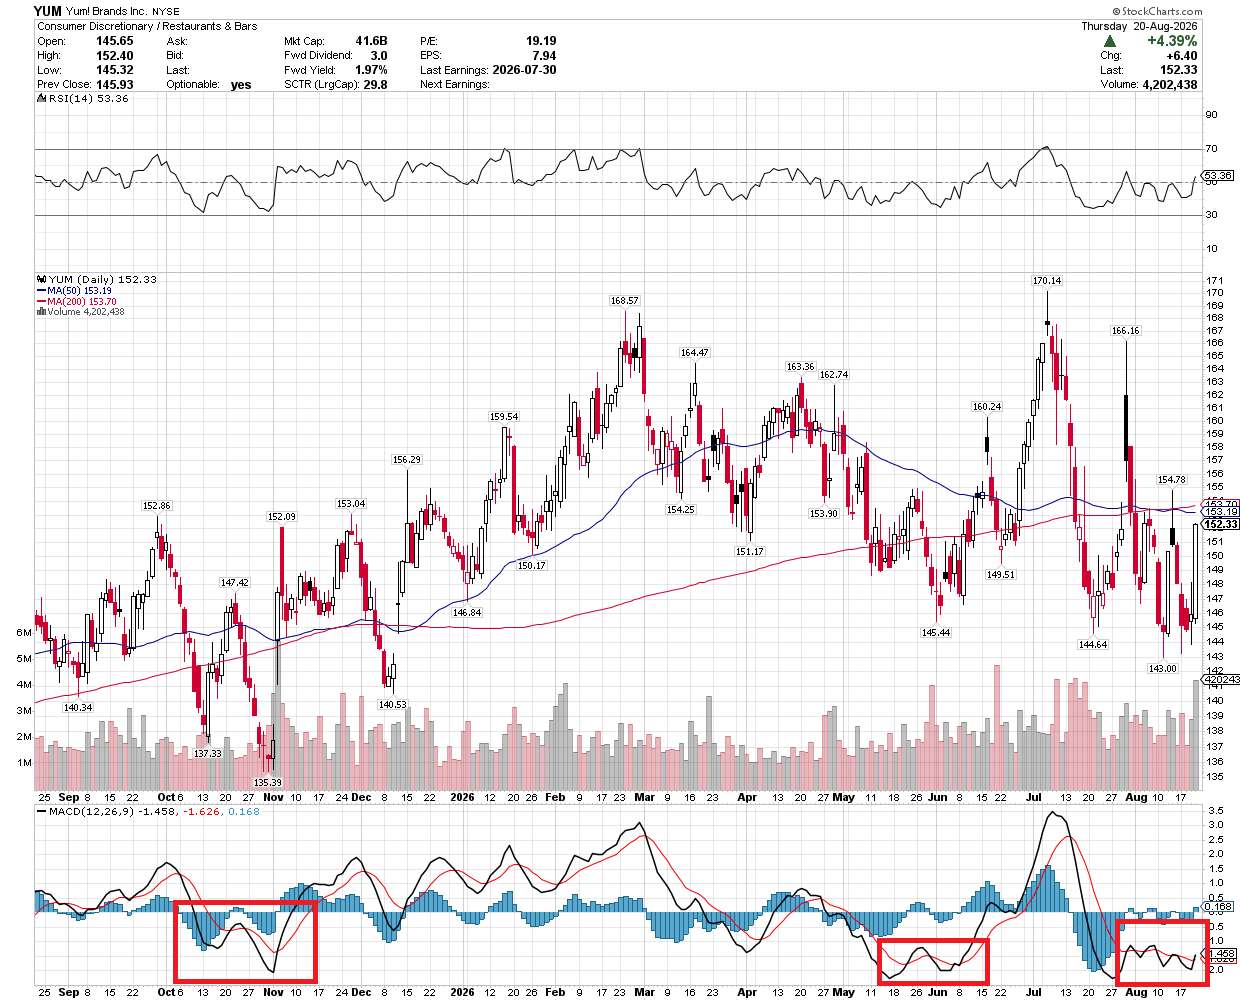
On this chart of YUM you can see in the red boxes on the MACD that it has a tendency to throw out false crossovers that look attractive but then fail. Some even check the boxes with additional confirmations on the RSI. This is a big warning not to trust this signal for this ticker.
Wendy Kirkland talked about it when she explained her DNA indicator. She noted that ticker have a “personality” of sorts and if you can spot the strong traits in that ticker, you can trade it more effectively.
In the case of YUM, it looks like it has been consolidating and is trying to breakout to the upside, but it is too risky for my taste. (pun intended).
Keep learning and trade wisely,
John Boyer
(If you want a look at Wendy’s DNA indicator, you can check it out here)










Recent Comments