
The market is trying to decide how much higher interest rates matter. As bond yields rise, the stock market is at a crossroads – do bulls take profits and protect gains in semi-conductors, continue buying, or simply wait-and-see what happens next?
It seems right now that there’s a lot of uncertainty in the most overbought sectors, and that points to the need to focus on stock picking and sector rotation for me. I want to look outside of the recent most bullish stocks. They may be in a buyable dip, but it seems just as likely that they could flip into liquidation, and that doesn’t bode well for a high probability of success.
As a result, I’m looking over the Stock Forecast Toolbox ideas and evaluating several different ideas that may be insulated from a market liquidation event and focusing on names that have an opportunity to continue to rise whether this dip is buyable or there’s more selling to come. In other words, I’m looking for stocks that seem to have minimal correlation to broad market behavior. And one name caught my eye: Henry Schein (HSIC):
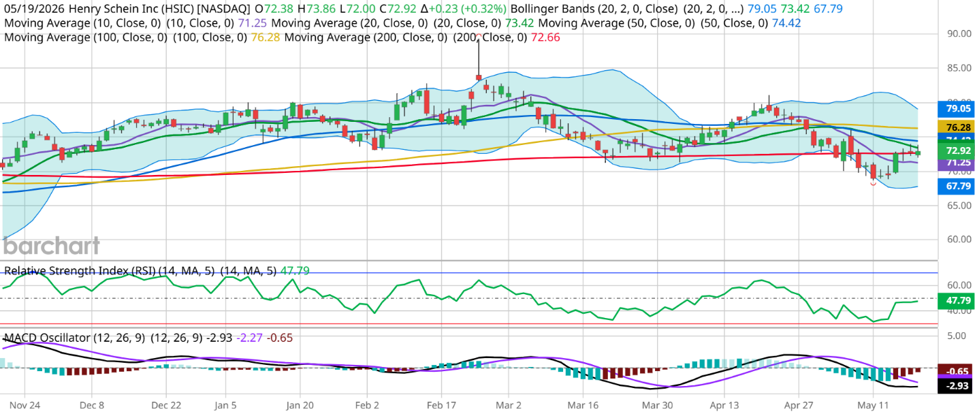
HSIC is navigating slightly higher over the last week and appears to be trading on its own fundamental and technical signals, with no major tie to broad market behavior. That seems natural, since it’s a health care services company that seems less likely to be impacted by other current macro-economic concerns. What I find particularly interesting here is that the technical analysis I applied gives me a target price at resistance around $80, the April highs. When I then checked the Forecast Toolbox, it perfectly aligned with my own expectations:
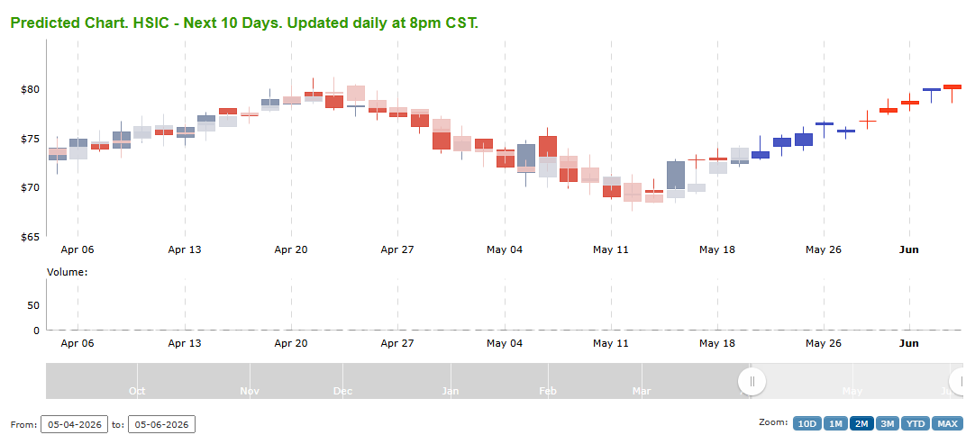
When my technical analysis aligns with the forecast toolbox projections, it certainly helps me gain confidence in my own thought process. The due diligence benefit of the forecast toolbox cannot be denied. I look at the list of stocks that the AI is projecting with a high confidence, and before I check the AI forecast, I do my own analysis. I can then check the AI forecast to see if the same conclusion was reached. If so, I feel increasingly confident and am more willing to execute the trade, and in this case, a June 18th $75 call for $1.65 looks particularly attractive with a potential 200% gain (or more) if the stock rallies to my (and the toolbox’s) projected resistance point at $80. That’s a recipe for success over the long haul. No trade setup guarantees success, but if I can improve the odds, I can outperform the market, and that’s a powerful advantage that I am excited to utilize daily.
As the market continues to search for direction and determines which stocks are leading the momentum higher, be sure to take advantage of the free 7-Day Trial of the Stock Forecast Toolbox!
If you have any questions, never hesitate to reach out.
Keith Harwood
Keith@OptionHotline.com


Recent Comments