From Keith Harwood, OptionHotline.com
This market is crazy, right? It’s completely irrational, and it’s incomprehensible that the NASDAQ 100 has lost over 1/3rd of its value this year.
Okay, maybe not. We all knew that stocks were getting overinflated due to FOMC policy, and the years of near 0% interest rates. But then inflation became more than just transient, and the FOMC had to act, and they had to act fast.
So, stocks started to go down, lead by the prior market leader that benefitted greatly from low interest rates for years: tech.
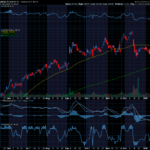
But, last week, oil companies got crushed. The RSI in OIH fell below 30. How does that seem logical with oil prices making highs on an almost daily basis (well, until the pullback last week, at least)?


As you can see, OIH took a major hit, while USO only took a relatively minor hit. So, maybe we’re starting to see signs that people are selling everything, not just the stuff that needed to be repriced lower. That’s traditionally a good sign that we are approaching a bottom, as we see investors throwing the proverbial baby out with the bathwater.
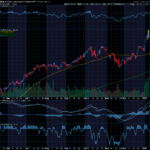
In this case, I’m focused on what the market and the FOMC are reacting to: inflation. And, if there’s a market parameter that can be an input to a fundamental model, there’s an ETF for that. And there are a couple of ETFs that are supposed to perform well when inflation is high. So, let’s look at how one of them is doing, with the ETF INFL:

Now, from the Horizon Kinetics site for this ETF (Horizon Kinetics are the managers of this ETF), we know the following as the purpose of this ETF:
The Horizon Kinetics Inflation Beneficiaries ETF is an actively managed ETF that seeks long-term growth of capital in real (inflation-adjusted) terms. It seeks to achieve its investment objective by investing primarily in domestic and foreign equity securities of companies that are expected to benefit, either directly or indirectly, from rising prices of real assets (i.e., assets whose value is mainly derived from physical properties such as commodities) such as those whose revenues are expected to increase with inflation without corresponding increases in expenses.
It certainly doesn’t seem like that’s the case right now, does it? The ETF is at lows and is down about 5% on the year – which is certainly better than tech, but not doing as well as I would have expected. And even more concerning, the ETF is down about 15% in the last 2 months. Is this the baby getting thrown out with the bathwater?
Perhaps this is that sign that we are selling everything irrationally, and maybe that means I can start to look for my signs of a bottom to confirm and let me enter a trade for a reversal of the trend. But, since markets can stay irrational longer than most of us can stay solvent, I’ll be waiting for those signs to increase my confidence.
If you’d like to learn more, please go to http://optionhotline.com to review how I traditionally apply technical signals and probability analysis to my options trades. As always, if you have any questions, never hesitate to reach out.
Keith Harwood
Keith@optionhotline.com


Recent Comments