
The critical indicator we looked at a couple days ago proved true and we saw another very strong signal yesterday. Being able to read these signs is important as the overall market trend will be able to tell you what trades have better odds of being successful. Getting that kind of edge is the key to repeated wins and pulling income from the market.
The SPY (the ETF that tracks the S&P) broke above its 200 day moving average yesterday and also moved above the most recent high. When the market closed yesterday it was hard to argue that market was headed higher. But when you look at premarket news it is easy to get rattled by future prices. Most news pages show the future prices on the major indexes and premarket numbers suggest that is what you are going to see when the market opens. I have a better way to think of those futures numbers.
This morning futures are down prior to the open and considering we have been in a down trend since the beginning of the year, it would give you the impression that we hit resistance as the SPY moved above its 200 day. Keith Harwood, who we talk with often, always reminds us to check multiple indicators to confirm the trend. Take a look at the SPY chart:
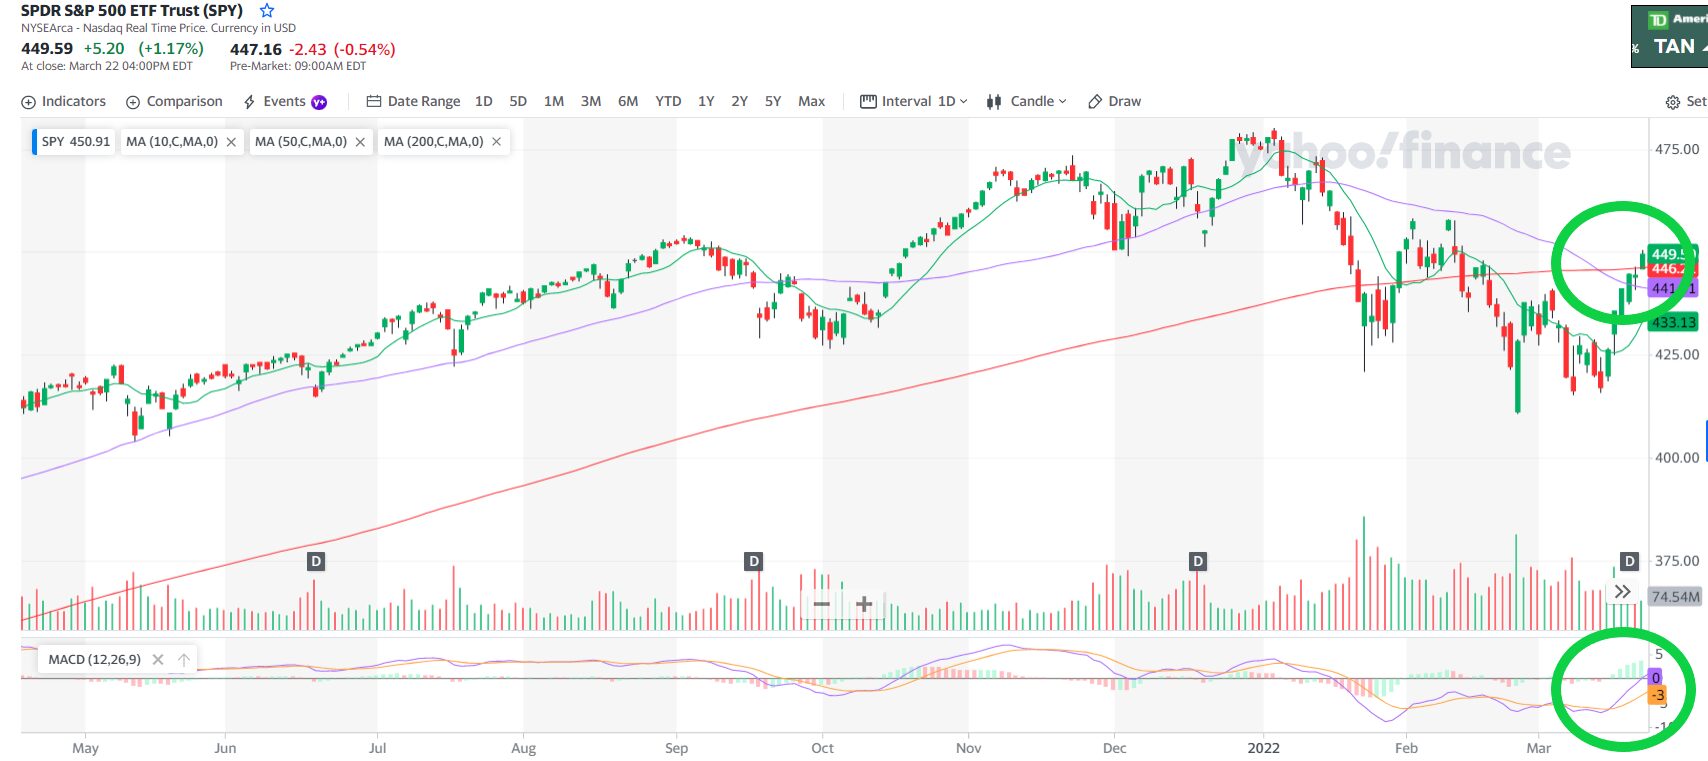

You can see SPY has broken through the 200 day moving average in the top green circle which is a strong signal that the trend will continue upward. Keith has often referred to the MACD in our video chats (you can check them out here) as a great confirmation indicator. If you look at the lower green circle you can see that it is showing a strong uptrend as well.
Like the other indicators listed here, MACD is available on most charting software. While you can save yourself a lot of math and simply click a few icons and add it to your chart is is critical to understand the basics. The indicator appears at the bottom of the chart.
It uses a short term and a long term moving average. Using the stock market from a long term perspective as an example, since its inception it has been on a steady rise. From a short term perspective, however the market has risen and fallen. Similarly, a short term moving average will better show the rise and fall within the trend of the longer term moving average.
The short term movements within the longer trend better highlights trading opportunities and helps identify good setups.
When you see a news story or some chart that has you second guessing yourself, going back to proven indicators can keep you on the right path.
To see other tricks market makers like Keith use to spot trades with the biggest potential, grab his Market Makers Cheat Sheet here.
Keep learning and trade wisely,
John Boyer
Editor
Market Wealth Daily


Recent Comments