
Happy Wonderful Wednesday!
Last week the Nasdaq was down 3 days out of 5 last week. I am typing this on Monday and the market is closed for the MLK holiday. When the market goes into a downtrend you can buy Puts instead of Calls. Today we are going to look at a Put.
To review past equity candidates, scroll down.
For today’s Trade of the Day, we will be looking at Salesforce.com, symbol (CRM). Before analyzing CRM’s chart, let’s take a closer look at the stock and its services.
salesforce.com, inc. develops enterprise cloud computing solutions with a focus on customer relationship management worldwide. The company offers Sales Cloud to store data, monitor leads and progress, forecast opportunities, and gain insights through analytics and relationship intelligence, as well as deliver quotes, contracts, and invoices. It also provides Service Cloud, which enables companies to deliver personalized customer service and support, as well as a field service solution that enables companies to connect agents, dispatchers, and mobile employees through a centralized platform, which helps to schedule and dispatch work, and track and manage jobs in real-time. In addition, the company offers Marketing Cloud to plan, personalize, and optimize one-to-one customer marketing interactions; and Commerce Cloud, which enables companies to enhance engagement, conversion, revenue, and loyalty from their customers. The company was founded in 1999 and is headquartered in San Francisco, California.
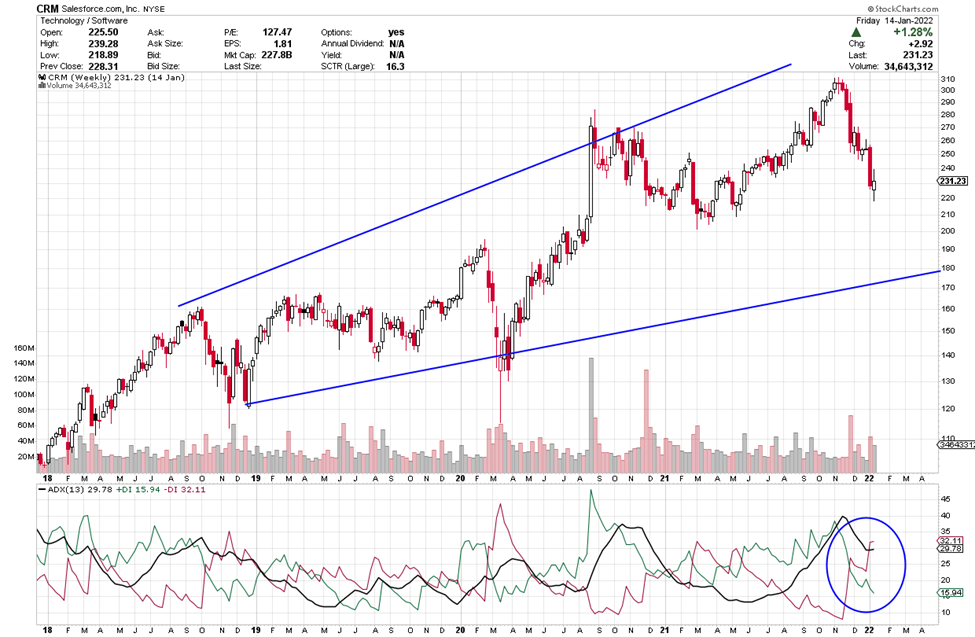
On the ADX indicator below the chart, notice how the red -DI line is on top of the +DI line (green) and the ADX. The black line of the ADX line has turned up. These are all signals of building bearish strength with the thought that price may move down.
For those who want more info on ADX, I give more details in the section below, or scroll down to the trade info.
Average Directional Index (ADX) Points to Direction and Strength
ADX is an easy indicator to interpret. The +DI line (green) is bullish and when it is on top, it suggests price is going to head up. When the -DI line (red) is on top, it suggests price is going to drop.
The black line is the strength line and when it heads up, it is telling you strength is moving into the DI line that is on top and in control. When the ADX line has been heading down, the DI line on top has been weakening and is ready for a change.
When the DI lines swap places and cross up and the ADX heads up, it suggests strength is moving into the new DI direction.
ADX signal = Profit Payout
Each candle on the chart represents price movement of a week. As the +DI heads up and moves further above the black line and both rise above the red line, it suggests there is bullish strength that could continue to grow, especially once the black line starts to turn up. If price continues to rise, the ADX line (black) will continue to turn to head up to imply that strength will continue to support the trade. As long as the ADX is heading up, it means it is supporting the bullish- up direction. The opposite is true if the -DI line heads up to cross the +DI line – this suggests bearish strength and a climb in price. If the ADX line heads up while the red line -DI is on top, is it saying strength is building into the downward direction.
I am looking at its chart and possible trade on Monday, but the pattern looks as if it is in a downtrend and will continue. The -DI may continue heading up if price keeps falling. You don’t want to consider entry if the current candle doesn’t move below 230 or if the -DI line were to turn down and drop below the ADX.
CRM Potential Trade
Please note and remember that I am typing this on Monday, two days before you receive it and the information, I am sharing could change over those two days and is intended to share the opportunities that options offer us.
Salesforce.com (CRM) has been heading down for a few weeks, suggesting that the downtrend is strong. It appears to be ready to head lower and the -DI has crossed up, if this continues, the pattern should remain intact as price keeps falling. Notice the -DI is above the +DI line on the chart above. We want the -DI to stay above the +DI (red line above green) to consider a Put trade. Then we’ll hope the ADX continues its upward strength.
Price is likely to fall further and move past the 230 entry. Its first target is 215 as the -DI (red line) stays above and the ADX (black line) continues to head up. Its current downtrend should remain intact, and price should continue to fall, perhaps even go lower. We will keep an eye on CRM over the next couple weeks.
To buy shares CRM today, price would be approximately $231. It would be silly to buy shares if you expect price to drop as we do. You’d wait until it hit a bottom and started to rise again.
This said, option trading offers the potential of a smaller initial investment and higher percentage gain even when price is expected to rise or fall. Let’s take a look.
If you bought one Put option contract covering 100 shares of CRM’s stock with a February 18th expiration date (Feb22) for the $230 strike premium would be approximately $10.40 today or a total of $1040 per contract. If price fell the expected $15 to the $215 target over the next couple weeks, the premium might increase approximately $8.00 to $18.40 per share or $1840 on your 100-share contract. This is a gain of $800 on your $1040 investment or a 77% gain over a couple weeks.
Remember you can close an option trade anywhere along the line before expiration to take gains or stop a loss.
Options can offer a win, win, win trade opportunity. They often offer a smaller overall investment, covering more shares of stock and potentially offer greater profits.
If you are having any kind of trouble taking advantage of these trades, I don’t want you to miss out. I have put together programs that help traders just like you access the potential profits that options provide. I write like we are having a conversation, so the information is easy to understand and apply. Be sure to check out the programs shared in this email and we will make it easy for you to get your share.
I love to trade, and I love to teach. It is my thing.
Yours for a prosperous future,
Wendy Kirkland
PS-I have created this daily letter to help you see the great potential you can realize by trading options. Being able to recognize these set ups are a key first step in generating wealth with options. Once you are in a trade, there is a huge range of tools that can be used to manage the many possibilities that can present themselves. If you are interested in learning how to apply these tools and increase the potential of each trade, click here to learn more.
Review of Past Candidates:
Last week we discussed buying a NFLX Put. The Jan 28th $500 strike would have cost $8.70 on Wednesday. If you sold the next day on Thursday the premium would have been $13.25 or a 52% profit. We will continue to monitor this trade this week.


Recent Comments