
I am not a genius, but this is obvious even to me. We saw the S&P repeat a pattern over and over. (check it out here). Now it is looking to continue its broken record and do it all again. Six times since the beginning of the year it has dropped below its 10 day moving average tested the 50 day, found support and then rallied back up.
We just watched it do it again over the last week or so. Don’t let this consistent rhythm lull you to sleep, trade it and grab a nice win. Take a look at the chart below:

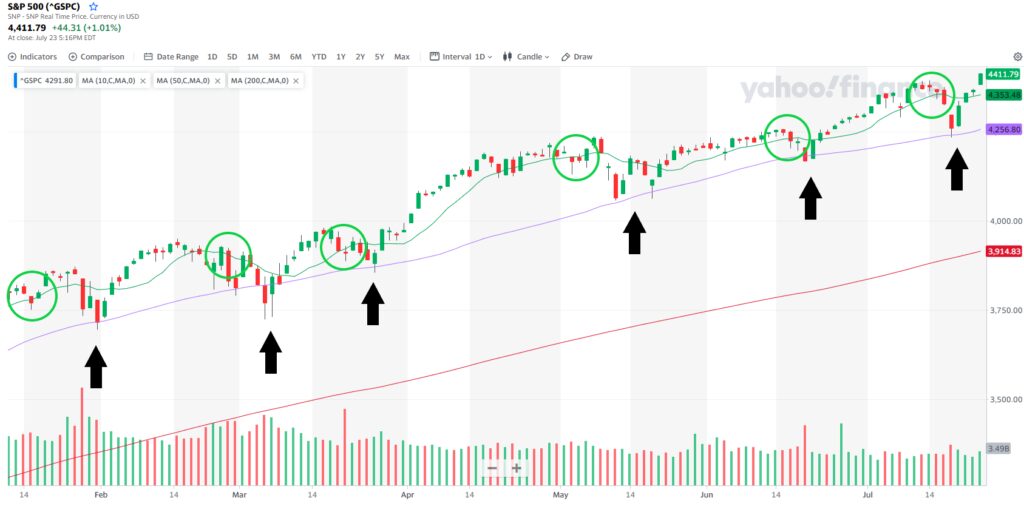
The arrows show each test and then rebound. The green circles show the very generous heads up the S&P provided to let us know what was coming. Each time it broke below the 10 day, it was a warning. Most times it even gave us a couple more days to pay attention. Then it did its little move down to the 50 and bounced up.
This predictability provides a great opportunity to use the right option strategy to set up a nice payday.
Don Fishback put together one of the best little guides for selecting the right strategy for the market. In addition to the strategy guide he shares (in simple, easy to read language) it offers other key tips to protect your gains and boost returns.
Be sure to grab a copy here and put the incredible likelihood of success on your side.
Keep learning and trade wisely,
John Boyer
Editor
Market Wealth Daily


Recent Comments